Table of Contents
Message from the Superintendent/President 3
Introduction 4
Overview and College History 6
Mission, Philosophy, Purpose, Principles of Community and Visional Educational Values and Goals 7
Environmental Scan- External to the College 9
Environmental Scan- Internal to the College 41
Institutional Effectiveness 88
Institutional Performance Expectations 88
Institutional Performance 93
Student Institutional Learning Outcomes (ILO) 108
Interventions 111
Grant Resources to Support Interventions 111
Ongoing Resources to Support New Interventions 121
Opportunities for the Future 122
Future Labor Markets 122
Planning for Potential New Programs 126
Faculty and Staff Visions for Curriculum and Delivery of Support Services 127
Opportunities for New Initiatives, Improvement or Expansion of Programs 145
General Areas of Opportunity 145
Possible Areas of Policy and Practice Modification 154
Possible Areas of Curriculum Expansion/Modification 161
New Career and Technical Education Possibilities 164
Key Planning Assumptions, Goals, and Strategic Priorities 168
Planning Assumptions 168
Visionary Educational goals and Strategic Priorities of the College 171
Strategic Priorities of the College 171
Projections for Future Growth 172
Future Capacity for the Growth 172
Baseline Term Analysis 175
WSCH Projections and the Future Program of Instruction 180
Space Projections 181
Acknowledgements 183
Appendix Materials 187
Appendix A- Neighboring Colleges and Distances 187
Appendix B- Industry Employment and Labor Force by Annual Average, 5-Yr Increments 188
Appendix C- Degrees and Certificates Related to Distance Education Substantive Change Proposal 191
Appendix D- Online Services and Forms Available to Students 193
Appendix Grant-Funded Intervention Summaries 203
Appendix Grant-Funded Interventions: Crosswalk of Major Intervention Effort Attributes 221
Appendix PM- Gavilan College Programs Matrix 223
Appendix SP- Gavilan College Strategic Priorities and Goals 224
Appendix T1- CSU Transfer Students from Gavilan, Major Field of Study 228
Appendix T2- UC Transfer Students from Gavilan, Major Field of Study 229
Appendix JOBS: Occupational Projections 230
Appendix X- WSCH Projection Details 2015-2030 246
Appendix Y- Space Projections Detail 2015-2030 252
Gavilan College has been serving the higher education needs of San Benito County residents since 1919, and South County residents since 1964. We have grown to be a 2,700 square-mile district with five locations and comprehensive instructional programs in numerous disciplines.
Throughout that history, we have periodically reflected on our practices and educational programs to ensure they remain relevant and continue to meet the academic and workforce needs of our community. With a new Superintendent / President on board, and a rapidly changing external environment, it is once again time to assess our operations and facilities in light of community goals. This Education Master Plan is a comprehensive review to determine how our curriculum, campus, and infrastructure will meet the current and future needs of our students. This document represents the findings of a thorough analysis of our strengths and opportunities for the future.
Gavilan College faculty and staff have done tremendous work to open our new Coyote Valley and San Martin locations, develop 22 Associate Degrees for Transfer, and to provide innovative Student Services for student success.
Our Career Technical Education division and Community Education department have worked together to bring on career training programs such as Water Resource Management, Unmanned
Aircraft Systems, and Hospitality Management.
This Educational Master Plan highlights some opportunities going forward – working with our community to build a “college-going mindset,” exploring a College Promise program, developing Guided Pathways, and assessing the potential to serve international students. In the areas of career training, there is potential to expand a business focus with customer service and business information worker training, and to support local manufacturers with advanced manufacturing and welding programs.
The completion of the Education Master Plan is just the start, however. It serves as a blueprint and will inform the district’s Strategic Plan, the Facilities Master Plan, and all of the action plans that will lead to enhanced student success. With the strong leadership of our Board of Trustees and the on-going support of our diverse communities, the future of Gavilan is exciting and truly portrays a college that is on the move!
Thank you for being a part of our journey.
Kathleen A. Rose, Ed.D. Superintendent/President
During the academic year 2016-2017 the Cambridge West Partnership, LLC (CWP) was invited to assist the College in developing a new Educational Master Plan (EMP). The purpose of the EMP is to explore the ways in which the College’s curriculum options might be optimized to match labor market needs, increase transfer opportunities, and align with community educational needs/interests. A second purpose of the EMP is to provide a projection of future attendance that can be used in the Facilities Master Plan to determine the amount and type of space that will be needed to accommodate the future academic program of instruction and support services. The Facilities Master Plan will cast the projected space need into a sequenced building and facility program that addresses the primary elements of site development and facilities planning through the year 2030.
Deliverables of the Plan
This Plan will deliver the following:
Describe environmental factors that impact the future of the College.
Provide a description and projection of economy and demographics of individuals living in the District service area.
Identify occupations with projected openings into the future.
Describe faculty visions for future curriculum and student services visions for anticipated future services.
Identify general opportunities for instructional program development.
Evaluate the mix of programs vs. labor market and transfer opportunities.
Provide a projection of future weekly student contact hours by discipline.
Framework for the Plan
The planning process principally relied on: (1) an analysis of the external and internal environment of the College including the demographic profile/characteristics; (2) the current and historical performance of the College relative to the areas of academic and support services; (3) the wisdom of those professional educators and administrators who are responsible for delivering the program of instruction and support services; and, (4) input from the CWP consulting team.
Underpinnings
The process for generating the EMP relied heavily on the analysis of the existing program of instruction, the dynamics of the service area, and the vision of future directions articulated by faculty, staff and administrators. It offers a discipline-specific set of recommendations and a broader assessment of the instructional mix of programs.
The 2015 fall semester was used as a "snapshot" in time from which a planning baseline was constructed. Although the College has experienced a downturn in enrollments from the high point of fall 2009, the 2015 fall term was selected as the benchmark because it
was the last complete term of data available to reflect the scope and breadth of the program of instruction and support services.
Analysis was also conducted relative to the demographic and income capacity of the "effective service area" of the College. This was defined as a geographic area with a sufficient and appropriate population base from which students of the future could be drawn. Additionally, a detailed look at the College was provided via an analysis of its external and internal conditions, its past characteristics and trends over a five-year period of fall terms from 2011 to 2015, its current productivity and efficiency, and its future needs for space.
At the present time the College offers a comprehensive curriculum at the approximately 170-acre main campus in Gilroy and an array of offerings at smaller Centers located in the City of Hollister and Morgan Hill. A regional public safety training center program of instruction and a limited number of other college courses are scheduled to open in spring 2017. The District has purchased land in Hollister to eventually build a permanent center there.
Forecasting the future program of instruction was based on determining weekly student contact hours (WSCH) in fall 2015, while the future space needs were largely predicted after defining a future program of instruction.
Activities
The development of the Plan included the following activities:
Referencing and use of the College data files for student basic demographics and enrollment information.
A review of the history and evolution of the College.
An environmental assessment (environmental scan) to consider the present and anticipated impacts both within and outside the College's service area.
The development of a "vision for the future of instructional programs and delivery of student services" derived from qualitative analyses.
The development of growth and enrollment estimates extending to the year 2030.
A review to assure that access and overall success of underprepared and underrepresented groups within the community were considered in the planning process.
The EMP is presented with the intent that it will serve as an educational programming blueprint for the College over the next six to ten years and support a facilities blueprint out to the year 2030.
Gavilan College was originally established in 1919 as San Benito County Junior College. Instruction was offered at Hollister High School. It operated under this title until 1963, when a new community college district was drawn that included both San Benito and southern Santa Clara Counties. Three high school districts- San Benito, Gilroy Unified, and Morgan Hill Unified districts pushed to have the college district boundaries redefined.
Successful passage of a local bond in 1966 provided the needed funds to construct the present, more centrally located campus at Santa Teresa Boulevard in Gilroy. College classes were offered in a temporary location at the Hollister Airport while the first facilities on the 170-acre parcel were being constructed. The Gilroy campus added buildings over time through state funding, with the final new building constructed in 2003.
In 1997 and 1998, satellite sites were established in Hollister and Morgan Hill to augment the offerings at the main campus location in Gilroy. With the 2004 passage of the Measure E facilities bond, Gavilan College had funds to upgrade the existing campus and secure permanent locations in Coyote Valley and San Benito County. These land purchases were completed in 2008. Measure E Bond funds also were used to make improvements in institutional and classroom technology, expanded online services, and improvements in safety, accessibility, and lighting.
The Gavilan Joint Community College District is comprised of 2,700 square miles encompassing southern Santa Clara County and the communities of Coyote, Morgan Hill, San Martin, and Gilroy. The District includes all of San Benito County and the communities of Hollister, San Juan Bautista, Tres Pinos/Pacines.
Mission1
Gavilan College cultivates learning and personal growth in students of all backgrounds and abilities through innovative practices in both traditional and emerging learning environments; transfer pathways, career and technical education, developmental education, and support services prepare students for success in a dynamic and multicultural world.
Principles of Community
As members of the Gavilan College community, we value the worth and dignity of every person, the pursuit of truth, devotion to excellence, acquisition of knowledge, and the nurture of democratic citizenship. We strive to maintain these ideals in an environment of inclusiveness and mutual respect.
The Principles of Community provide the foundation which creates this environment. The expectation is that we maintain the highest ethical standards in order to establish an atmosphere of civility, honesty, cooperation, professionalism and fairness.
Gavilan College aspires to be:
Diverse
We embrace and celebrate diversity in all its forms (the heritage, achievements, uniqueness, and contributions of all our members) and seek to uphold an inclusive, open and enlightened community.
Purposeful
We are a community that maintains a shared commitment to service to society and advancement of knowledge through innovative teaching and learning.
Open
We believe free exchange of ideas requires mutual respect, trust and consideration for our differences.
Just
We are committed to respect for individual dignity and equitable access to resources, recognition and security.
These Principles of Community, reflected in Board Policy 2715, guide the institution's actions. They provide guidelines to follow and are to be considered a living document. Adherence to the Principles of Community is the professional responsibility of all staff. Behavior that is in conflict with the principles will be subject to administrative review.
![]()
1 The mission is evaluated and revised on a regular basis.
Ultimately, Gavilan College is dedicated to fulfilling its mission with compassion, caring and understanding, while respecting all individuals.
Philosophy
Gavilan College is committed to educational excellence. The college aspires to be an exemplary, student-centered community college through leadership, planning, and a commitment to ongoing improvement. Its services and programs are designed to instill the values of critical thinking, life-long learning, cultural understanding, and community service. Gavilan's quality of service to students is closely bound to the quality of the college staff.
Gavilan College strives to accomplish its mission with creativity and innovation and with a proactive, accessible and sensitive presence in the diverse communities it serves. The college is dedicated to fulfill its mission with compassion, caring and understanding and holds, in high regard, the respect and worth of all individuals.
Purpose
Gavilan College offers a wide range of services, including programs of community education, study in the liberal arts and sciences, and study in the pre-professional, business, vocational, and technical fields. To support student success, we offer services that strengthen and augment the learning environment. Courses and programs of study are offered days, evenings, weekends, and online. All offerings are designed to assist students in meeting their educational and life goals.
Visionary Educational Values and Goals Values
An imaginative and nurturing community of learners, fostered through rigorous scholarship, creativity, and personal and professional development.
A college environment and social climate characterized by inclusiveness and mutual respect for all of our students, staff, and community.
Excellence in and promotion of comprehensive programs, services, and activities.
Partnerships that support the educational, economic and social development of the college and the communities we serve.
Goals
To be known for educational excellence
To demonstrate involved and responsive community leadership
To increase our accessibility
To encourage innovative instruction
To lead in the application of appropriate educational technology
To promote a harmonious learning and working environment
The College in Context to its Environment
The official Gavilan Community College District boundaries cover some 2,700 square miles of land located in the southern portion of Santa Clara County and all of San Benito County. The main campus of the College is in the City of Gilroy, along the US 101, approximately 86 miles from downtown San Francisco and 37 miles from downtown San Jose. The western border of the official Gavilan College District area is the Santa Cruz and Monterey County lines. The Merced and Fresno County lines in the east are the ends of the District area and Monterey and Fresno County lines define the southern border.
The three principal cities of the official District service area where most population resides are Gilroy, Morgan Hill, and Hollister. Distances from the campus location to neighboring community colleges are found in Appendix A.
Economy and Employment
The California economy is expected to continue its expansion and growth. In 2014 and 2015 State revenue has been greater than projected. However, the actual revenues for 2016 are slightly behind projections. Nevertheless, for K-14 public education, the adverse economic circumstances of the Great Recession seem to have concluded.
Although the State economy appears to be on the mend and unemployment levels continue to diminish, a recent report from the Public Policy Institute of California (PPIC) observed that if recent trends in higher education and the economy were to continue, by 2030 the State is likely to face a shortage of workers who need some college education up to and including a bachelor’s degree. Their projections, and those of the Centers of Excellence, are that the shortfall of workers with a Bachelor’s degree may be as high as
million to replace workers who will retire. 2 The expected growth of the state economy is projected to create 1 million new middle-skill jobs and 1.4 million replacement jobs for these occupations by 2025.3 Together, these needs are even larger than the projected one-million-worker shortage of college graduates with a bachelor’s degree. The analysis affirms that training beyond high school has become increasingly valuable in the labor market.
The State of California and the Bay Area experienced the extremely severe recession starting in December 2007. In the years since the start of the Great Recession job growth in California has grown 5.4%, well ahead of the nation at 3.7%. Some parts of the state economy have not fully rebounded to the pre-recessionary levels, but the gross domestic product (GDP) is growing and the Silicon Valley regional economy is leading the state recovery with a job growth of 14.7% between 2007 and 2016.4 The unemployment rate
![]()
2 Johnson, Hans, et. al., “Addressing California’s Skills Gap,” Public Policy Institute of California, April 2016. “California’s Future-Higher Education.” February 2015.
3 Centers of Excellence. Focus on 2025: A 10-year Middle-Skill Occupational Outlook for California.
Retrieved 4/17/16 from http://doingwhatmatters.cccco.edu
4 Allegretto, Sylvia. California’s Labor market: Eight Years Post-Great-Recession. Center on Wage and Employment Dynamics, University of California, Berkeley. May 2016
has dropped substantially and wage rates are increasing, particularly in Santa Clara County. Unfortunately, the housing prices in the area are some of the highest in the nation and the Bay Area Peninsula is short some 60,000 additional housing units to keep pace with population growth. This housing shortfall and regional transportation challenges are severely limiting economic growth.5 In the November 8, 2016 election residents in Santa Clara County overwhelmingly approved Measure A to provide funding for low income housing assistance and other local housing initiatives and also approved Measure B to fund improvements for Caltrain, BART, selected roadways and the regional bicycle infrastructure.6
The Bay Area economy is now rooted in a diverse, competitive set of industries. Technology is transforming industries such as finance, accommodations, and transportation. If the Bay Area were a country, it would be the 21st largest or equivalent to a mid-sized European nation. Twenty-eight of the global Fortune 500 and 29 of the US Fortune 500 companies are headquartered in the Bay Area and none have left the area since 2011. Beyond technology the Bay Area economy has a robust tourism sector.7
The Central Coast Regional (San Benito to Ventura counties) economy is largely driven by tourism, food manufacturing, and agriculture. The region experienced economic downturn before the state slid into the Great Recession. Within the Monterey Bay area employment opportunities were significantly curtailed when the housing market crash began in 2007-08. 8
San Benito County has not fared as well as the Silicon Valley with respect to rebounding from the Great Recession. The unemployment rate has been higher than the statewide and national averages. Although foreclosures were common between 2007 and 2012, they have since declined. The housing market appears to have rebounded, particularly around Hollister. The largest industry in the County is agriculture. It has contributed slow, but steady growth in employment opportunities. While tourism has been a major factor in the economy, the transportation demands on the infrastructure are projected to outstrip capacity. With housing costs at an all time high in the Bay Area, San Benito County has witnessed a sharp increase in urbanization with the largest number of farmland acres lost among the Bay Area counties (Santa Cruz, San Benito, and Monterey). During the Great Recession San Benito County experiences significant housing foreclosures. Since the high point of 2008, foreclosures have tapered off and the median price of homes has become within the grasp of middle-class families.9
![]()
5 Levy, Stephen. The Peninsula Economy. Institute for Regional Studies, Joint Venture Silicon Valley. November 2016.
6 Santa Clara County Registrar of Voters. Election Results. Retrieved November 11, 2016 from http://results.enr.clarityelections.com/CA/Santa_Clara/64404/183053/Web01/en/summary.html
7 Bay Area Council Economic Institute. Promise and Perils of an Accelerated Economy: Bay Area Economic Profile, Ninth in a Series. May 2016.
8 Association of Monterey Bay Area Governments. State of the Region. 2012
9 Association of Monterey Bay Area Governments, Regional Analysis and Planning Services. State of the Region. 2012
Historic counts, 1990 to 2015, of industry employment and labor force by annual average for both Santa Clara and San Benito counties are found in Appendix B of this Plan.
The future is looking a little brighter for San Benito and Santa Clara Counties. Between 2012 and 2022 the California Employment Development Department (EDD) projects an annual average 1.4% increase in jobs. The greatest growth is concentrated in three industrial sectors: (1) professional and business services (25%), particularly in computer system design and related services; (2) educational services (private), health care, and social assistance (25%), with the ambulatory health care services contributing almost 9,000 jobs; (2); (3) information (33%). The following charts document the projections in the two large regional areas and between the two counties for employment opportunities by industry category and illustrate the differences.
Chart 1: San Francisco Bay vs. Coastal Region Projected Job Growth by Industry, 2012- 2022
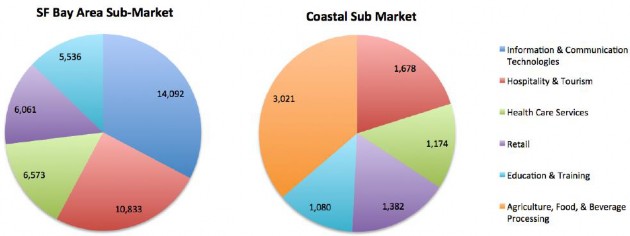
Source: California Employment Development Department, Labor Market Information; analysis by Cambridge West Partnership, LLC
Chart 2: San Benito-Santa Clara County Projected Job Growth by Industry, 2012-2022
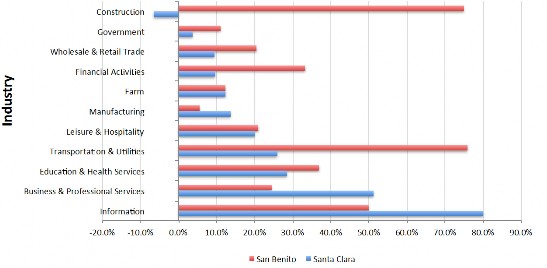
Source: California Employment Development Department, Labor Market Information; analysis by Cambridge West Partnership, LLC
Translating the percentages of growth into actual numbers of jobs within each county illustrates the dramatic difference in the size of future employment opportunities in Santa Clara vs. San Benito counties. The greatest percentage annual projected growth among the eleven industry groups has been marked in bold.
Table 1: Projections of Job Growth by Industry and County 2012-2022
Santa Clara San Benito
North American Industry Classification System (NAICS) Category
Employment Change 2012-
2022
Annual
%
Change
Employment Change 2012-
2022
Annual
%
Change
Business & Professional Services | 90,700 | 5.1% | 230 | 2.4% |
Construction | -2,200 | -0.6% | 540 | 7.5% |
Education & Health Services | 38,800 | 2.9% | 380 | 3.7% |
Farm | 410 | 1.2% | 190 | 1.2% |
Financial Activities | 3,200 | 1.0% | 100 | 3.3% |
Government | 3,300 | 0.4% | 300 | 1.1% |
Information | 43,300 | 8.0% | 50 | 5.0% |
Leisure & Hospitality | 16,300 | 2.0% | 250 | 2.1% |
Manufacturing | 21,100 | 1.4% | 150 | 0.6% |
Transportation & Utilities | 3,300 | 2.6% | 220 | 7.6% |
Wholesale & Retail Trade | 11,000 | 0.9% | 530 | 2.0% |
Total 229,210 2.6% 2,940 2.1%
Source: California Employment Development Department, Labor Market Information; analysis by Cambridge West Partnership, LLC
The workforce, by industry, in the College effective service area (ESA) is described in the following two tables. The tables account for 967,335 adults in the workforce who are
age 16 or older. Employment in the services industry dominates the economy in all of the census places within the area. The proportion of employment in manufacturing and retail trade industries are similar and represent the second and third important sectors.
Table 2: Employment by NAICS, 2016
North American Industry
2016 Adults 16 Years or Older Employed in These Industries Effective
Classification System (NAICS) Category
Service Area
Morgan
Hill Gilroy Hollister
San Martin
w/o ESA Average
Agriculture/Mining | 0.7% | 1.8% | 6.1% | 7.1% | 4.9% | 5.0% |
Construction | 5.0% | 7.2% | 9.0% | 8.7% | 12.8% | 9.4% |
Manufacturing | 18.7% | 15.8% | 11.6% | 11.2% | 18.9% | 14.4% |
Wholesale Trade | 2.2% | 3.3% | 3.1% | 4.7% | 2.1% | 3.3% |
Retail Trade | 9.2% | 9.9% | 12.4% | 12.1% | 8.5% | 10.7% |
Transportation/Utilities | 2.7% | 3.3% | 3.1% | 4.6% | 2.6% | 3.4% |
Information | 3.9% | 2.5% | 1.3% | 1.0% | 1.0% | 1.5% |
Finance/Insurance/Real Estate | 4.7% | 5.8% | 4.0% | 4.1% | 5.1% | 4.8% |
Services | 50.8% | 47.4% | 45.7% | 41.4% | 42.4% | 44.2% |
Public Administration | 2.2% | 3.0% | 3.5% | 5.0% | 1.7% | 3.3% |
count of adults 967,335 21,719 26,506 18,195 3,449 Source: Environmental Systems Research Institute, Market Profile, 2016; analysis by Cambridge West Partnership, LLC
Employment in white-collar occupations dominates the economy in the effective service area and in the three census places (Morgan Hill, Gilroy, and Hollister. Blue-collar occupations provide the second largest group of jobs in Hollister and Gilroy.
Table 3: Adult Employment by Occupation, 2016
Adults 16 Years or Older Employed in These Occupations, 2016 Effective
Occupational Families
Service Area
Morgan
Hill Gilroy Hollister
San Martin
w/o ESA Average
While Collar | 58.4% 17.8% 23.9% | |||||
Management/Business/Financial | 19.2% | 20.5% | 14.1% | 11.5% | 25.2% | |
Professional | 31.7% | 23.4% | 17.1% | 13.4% | 17.6% | |
Sales | 9.3% | 11.6% | 10.7% | 11.4% | 11.1% | |
Administrative Support | 10.0% | 11.5% | 12.1% | 11.9% | 10.4% | |
Services | 15.2% | 16.5% | 18.3% | 19.6% | 16.6% | |
Blue Collar | ||||||
Farming/Forestry/Fishing | 0.4% | 1.0% | 4.7% | 5.4% | 2.3% | |
Construction/Extraction | 3.9% | 5.1% | 7.5% | 8.7% | 6.7% | |
Installation/Maintenance/Repair | 2.2% | 2.5% | 3.7% | 3.4% | 1.4% | |
Production | 4.7% | 4.5% | 5.4% | 6.0% | 3.5% | |
Transportation/Material Moving | 3.4% | 3.5% | 6.3% | 8.6% | 5.2% |
count of adults 967,335 21,719 26,506 18,195 3,499
Source: Environmental Systems Research Institute, Market Profile, 2016; analysis by Cambridge West Partnership, LLC
The population in Gilroy, the largest city in the Gavilan College District service area, has grown faster than all cities in Santa Clara County. Job growth is expected to be modest over the next decade and will likely occur in retail, transportation, construction, hospitality, information, and health care industries. The proximity to Silicon Valley makes Gilroy an attractive location for businesses seeking lower-cost locations for expansion. Developing more affordable housing units in Gilroy will be a challenge for municipal authorities. Roughly 40 percent of the housing stock in Gilroy is rented and rent levels are more affordable than purchase prices.10
![]()
10 City of Gilroy. Gilroy Economic Development Strategic Plan. February 19, 2014
One of the striking features of the economic dynamics in the region is the number of workers who commute into other counties for work, particularly from San Benito into other counties.
Table 4: Top Five Commuting Destinations 2006-2010
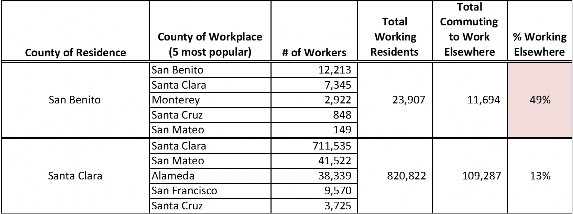
Source: Bay Area Census, American Communities Survey Commute Flows Survey 2006-10; analysis by Cambridge West Partnership, LLC
The analysis of commuting habits of those who live in the three primary cities within the official district service area indicates a great deal of commuting has been taking place. In the case of Morgan Hill, two-thirds of the residents commute to other places for work.
Half of the workers in Hollister commute elsewhere to work while 56% of those who live in Gilroy commute elsewhere for work.
Table 5: City Level Commuter Flows 2006-2012
Works in | Total Working Population | Total Commuting to Work Elsewhere | % Working Elsewhere | |||||
Gilroy | Morgan Hill | Hollister | San Jose | |||||
City of Residence | Gilroy | 8,210 | 1,690 | 230 | 4,425 | 18,495 | 10,285 | 56% |
Morgan Hill | 945 | 5,285 | 90 | 5,455 | 15,953 | 10,668 | 67% | |
Hollister | 1,275 | 515 | 5,960 | 1,170 | 11,903 | 5,943 | 50% | |
Source: Bay Area Census, American Communities Survey Commute Flows Survey 2006-10; analysis by Cambridge West Partnership, LLC
Implications for the College
In the broader regional San Francisco Bay Area the dominant growth industry is in information and communications technologies followed by hospitality and tourism. Conversely in the greater regional area of the Costal counties the dominant growth is in agriculture, retail, and construction materials and services
industries. Employment opportunities are projected to continue into the future but they may not be in the cities located within the Gavilan official district service area. Although entry-level preparation for many jobs in some of these industries commonly does not require education beyond high school, there may openings for which the College needs to prepare individuals with career and technical certificates and Associate Degrees.
Future job opportunities and economic growth in construction, trade, and education/health care/social assistance industries, plus a much improved real estate market with affordable housing characterize the future of San Benito County. Business and professional services and information industries, but a costly real estate market, characterize the future of Santa Clara County. The College can contribute to the economy of counties by preparing students for transfer to four-year institutions. For those students who want to “transfer to the workplace” upon completing a certificate or Associate Degree, the College can offer instruction that will equip them with in-demand job skills.
The distinctive mix of advanced manufacturing, information and communications technologies, and research and development businesses places a premium on Science, Technology, Engineering, Mathematics, and Medicine (STEMM) fields of study. The College has well-established programs of study in these disciplines but will be called upon to increase the numbers of graduates.
The municipal and county governments need to facilitate construction of affordable housing in order to stimulate the future population growth. If they are successful, that will bring a new audience for the College to woo.
Higher Education Policy
Several key policy decisions will influence the California Community College system in the coming years. These public policies both provide opportunities for the colleges but in some cases impose constraints.
The Completion Agenda
In July 2009, President Obama articulated that the American Graduation Initiative (AGI) has a goal of increasing the percentage of U.S. residents who earn high-quality degrees and credentials from the present rate of 39 percent to a rate of 60 percent by the year 2025. The goal is to make the U.S. competitive in the global marketplace. In the private sector, employers have been increasingly screening applicants for employment by requiring college degrees for positions that previously did not require a degree.11
After President Obama has pushed to increase college graduation rates across the nation, Complete College America, a non-profit organization, was formed to advance this mission. It has enlisted support from leaders in 34 states to ensure greater numbers of students acquire degrees.
![]()
11 Doug Lederman. “Credential Creep Confirmed” Inside Higher Education. September 9, 2014; Karin Fischer. “A College Degree Sorts Job Applicants, but Employers Wish It Meant More,” Chronicle of Higher Education. March 8, 2013 p. 26-29
The President’s challenge to the nation has not been ignored in California. The Community College League of California (CCLC) launched an “alternative futures” project, 2020 Vision for Student Success, to respond to the national graduation goal by identifying policy and practice changes that could be implemented to increase student achievement. To contribute its part toward achieving the national graduation goal, California needs to produce a total of 1,065,000 degrees or certificates per year to 2025. That translates to producing an additional 23,000 degrees and certificates per year, a 5.2% annual increase.12 The California Public Policy Institute has repeatedly informed state policy makers that the State faces a skills gap.13
In August, 2014, the Board of Governors for the California community college system joined in the completion effort by announcing a goal to increase the numbers of students earning certificates, degrees, or transferring to four-year institutions by nearly a quarter of a million over the next ten years. For academic year 2013-14 the system awarded 190,314 certificates and degrees, a 40 percent increase from 2009-10 and an all-time high for the system. The Gates, Ford, Lumina, and Kellogg Foundations as well as the Carnegie Corporation of New York fund their collective work and the efforts of others to promote more college graduates. Collectively, there are more than two-dozen major entities that have sponsored initiatives to promote college completion.14
Federal Policy and Funding Initiatives
The Congress passed the Higher Education Opportunities Act in 2008. Subsequently, a series of new federal regulations have been issued to improve program integrity where Title IV financial aid funds are involved. Regional accrediting bodies are now expected to provide closer scrutiny of member institutions on a range of new topics. The Higher Education Act has been due for renewal and no one can predict its future direction.
The Obama administration and the U.S. Department of Education have announced a new emphasis for their involvement with career and technical education through a transformation of the Carl D. Perkins Career and Technical Education Act of 2006 as it comes due for renewal. Although the Act has not yet been renewed, the desired new directions will promote greater alignment between CTE programs and labor market needs as well as collaboration with K-12 and employers. Differences in the current provisions of the Perkins Act and the proposed changes were announced as long ago as April 2012.15
In July 2014 the Congress enacted the Workforce Innovation and Opportunity Act (WIOA) by a wide bipartisan majority as the first legislative reform in the past 15 years of the public workforce system. This legislation took effect on July 1, 2015 with regulatory rules written by the Departments of Labor (DOL), Education (DOE), and
![]()
12 2020 Vision: A Report of the Commission on the Future, (Sacramento, CA: Community College League of California, 2010)
13 Public Policy Institute of California. California’s Future: Higher Education. January 2016 and Higher Education in California. April 2016.
14 Alene Russell. “A Guide to Major U.S. College Completion Initiatives,” American Association of State Colleges and Universities, October 2011.
15 U.S. Department of Education, Office of Vocational and Adult Education. Investing in America’s Future: A Blueprint for Transforming Career and Technical Education. April 2012.
Health and Human Services (HHS). In general, the legislation eliminates 15 existing federal training programs and focuses on streamlining programs, reporting, and administration. WIOA keeps the basic structure of the prior legislation, with components covering occupational training, adult basic education, literacy and English language acquisition, vocational rehabilitation, and the national system of public employment offices and services. Key features and opportunities of the WIOA legislation include requirements for more unified planning between state and local authorities to address regional labor markets, a common set of performance measures, and promotion of best practices including contextualized adult basic education, ESL, and attainment of industry- recognized certificates.
The White House convened a series of higher education summits in order to promote change in higher education policy and practice. Attention was given to greater access, particularly for low-income students, the completion agenda, college outcome performance measures, constraints to the ever-rising costs of high education, and other topics of interest to the federal government. To encourage more participation in postsecondary education the President used his 2015 state of the union address to offer a proposal, along the lines of the current policy in Tennessee, that the federal government help each state to make attendance at a community college free of tuition. By mid-spring 2016 there had been launched 27 new free community college programs.16
While it has been announced that some new federal resources will be allocated for use by community colleges, the Congress is currently also struggling to restrain spending and to reduce debt levels. The long-term impact remains to be seen, but federal aid now has a lifetime limit and is also limited to a maximum number of credit hours represented by 150% of the credits required for the program of study the student is pursuing. For a community college associate degree 150% would equate to 90-semester credit hours.
Veterans on the G.I. Education Bill may be more limited in the credit hours funded by that program. In the FY2016 budget the President proposed that the maximum award under the Pell Grant program would increase and new rules would require students to make progress in their programs by passing an increasing percentage of their total course load. In a December 2015 budget deal the Congress unexpectedly agreed to increase the Pell grant maximums and provide additional funds to college access programs for needy students (TRIO and GEAR UP). President Obama has signed an executive order to align the monthly repayment rate of federal loans to the level of future wages earned by the student. That may ease the burden of debt for students and make the act of borrowing for a college education more feasible for prospective students. The President has also declared a policy to not enforce deportation on children of illegal immigrants meeting certain conditions and to provide work permits for those children.
Regional Accreditation Initiatives
In part, stimulated by prior federal government actions, all regional accrediting bodies are insisting that greater attention be given to student learning outcomes.
![]()
16 White House Press Release. White House Launches $100 Million Competition to Expand Tuition-Free Community College Programs that Connect Americans to In-Demand Jobs. April 25, 2016.
These new areas are in addition to the traditional goals of accreditation that are:
Providing assurance to the public that the education provided by the institution meets acceptable levels of quality
Promoting continuous institutional improvement
Maintaining the high quality of higher education institutions in the region
Implementation of the new ACCJC 2014 accreditation standards has introduced a number of changes, including the requirement to create a quality focus essay to guide future improvement efforts. 17 The changes also echoed some of the national discussions about educational quality and accreditation.
California Community College Initiatives for Student Success
The following State initiatives are intended to increase student success rates:
The Board of Governors’ basic skills initiative seeks to enable more students to overcome their academic deficiencies.
Targeted funds for student equity and student success and support programs.
Additional legislation, SB1440 Student Transfer Achievement Reform or STAR Act in 2010, simplified the process of transferring from a community college to a school in the California State University (CSU) system. This program provides a pathway for students to follow so that they can be admitted to a CSU with junior status. It has been complemented by SB440 in 2013, which further incentivizes transfer students to complete an associate degree.18
The long-standing commitment to basic skills education has sometimes suffered for lack of adequate funding. However, in the 2016-17 budget there was a $30 million increase in this targeted allocation. In May 2016 the Chancellor’s Office announced a request for applications to be awarded up to $60 million from Proposition 98 funds to implement or expand evidence-based innovations and redesign in the areas of assessment, student services, and instruction in order to improve the progression rate of basic skills students into college level instruction. Known as the Basic Skills and Student Outcomes Transformation Program, the funds were awarded to 43 colleges.
As second pool of funds was awarded to basic skills partnerships between community college districts or a consortium of districts and at least one California State University for the purpose of developing efficient and effective methods of coordinating remedial instruction and services. Successful applicants centered their proposals on evidence-based remedial education, instructional redesign, or program expansion. Five project proposals were awarded a total of $10 million.
Perhaps the most potentially far-reaching set of recommendations for change in policy and practice were included in the report from the California Community College Chancellor’s Office Student Success Task Force. The group proposed eight areas of focus
![]()
17 Accrediting Commission for Community and Junior Colleges. Preparing for A Comprehensive Visit. Workshop materials presented on October 15, 2014.
18 Campaign for College Opportunity. Keeping the Promise: Going the Distance on Transfer Reform.
March 2016.
with 22 recommendations. The Legislature passed the Student Success Act (SB 1456) in August 2012 and the governor signed it shortly thereafter. The measure did the following:
Commissioned the development of a uniform placement exam for students;
Directed colleges to provide students with orientation, assessment, placement and counseling services;
Required students to identify an educational goal (such as degree or certificate for transfer to a four-year university) and complete an educational plan;
Required colleges that receive student support service funds to complete and post a student success scorecard showing how well the campus is doing in improving completion rates, especially by race, ethnicity, gender, and income;
Established minimum academic progress standards for students to receive Board of Governors fee waivers, but also developed an appeal process.
The Task Force recommendations came in the wake of a severe shortfall in resources for California’s public higher education institutions. Therefore, implementation of these ideas was delayed.
Funds allocated for 2015-16 enabled the Chancellor’s Office to provide support to colleges that develop a student success and support plan (formerly matriculation) built around some of the recommendations arising from the Student Success Task Force. The provision of effective core services (orientation, assessment and placement, counseling, academic advising, and early intervention or follow-up for at-risk students) has been found to improve students’ ability promptly to define their educational and career goals, complete more of their courses, persist to the next term and achieve their educational objectives in a timely manner.19 As new priority enrollment rules were made effective in fall 2014, one of the incentives for students to complete the core services was the potential loss of priority enrollment or withholding of an enrollment opportunity.
One Student Success Task Force recommendation was the development of a robust common assessment instrument. The assessment services will also include data collection and course placement guidance, but the placement cut scores will remain a local decision. Working groups of faculty from the disciplines of English, Math and ESL have been involved in drafting competencies that address the full range of prerequisite skills found in the curriculum. The common assessment initiative has a “go live” target of the 2016- 17 academic year, pending a successful pilot experience.
The effort to exploit technology to support student success blossomed into the Educational Planning Initiative that was launched to help colleges meet the requirements for student success and support program funding by providing an individual comprehensive educational plan for all students. The initiative is also intended to enhance the counseling experience by inducing students to take more responsibility for their educational program plans and to have counseling expertise used only to verify the planning. A degree audit system to provide transcript, articulation and curriculum
![]()
19 Eva Schiorring and Rogeair Purnell. Literature Review Brief: What We Know About Student Support 2nd
Ed. Research and Planning Group of the California Community Colleges. Fall 2012.
inventory elements is to be provided to help both students and counselors. As a by- product, it is hoped that the numbers of unnecessary units accumulated by students will be reduced. A single sign-on portal is intended to be the student’s point of access to this system that is described as a service-oriented experience in which some existing services will be complemented by new services yet to be produced. The project has a “go live” target of the 2016-17 academic year, pending a successful pilot experience.
The legislation implementing some of the recommendations of the Student Success Task Force, SB 1456, requires the coordination of student equity plans and student success and support programs. Student equity identifies groups of students needing more help and focuses on services and instruction for new and continuing students through to completion whereas student success and support programs focus on services for entering students and identifies individual students who need more help. Interest in student equity is not new as the Board of Governors adopted a student equity policy in 1992, but financial support for planning and interventions has not always been available or adequate. In 2014 the Legislature appropriated $70 million for student equity purposes, added foster youth, veterans, and low-income students as target populations, and required specific goals and activities to address disparities and coordination of them with other categorical programs. The traditional populations or variables researched for student equity planning are: age, disability status, gender and ethnicity. Unlike the student success and support program funding, dollars for student equity interventions do not require a match of funds or in-kind effort from the colleges. Funding for both efforts was increased for 2015-16 after the May 2015 budget revision. An additional increase is proposed for 2016-17.
The governor’s interest in online education garnered an appropriation of $56.9 million over 55 months to launch the Online Education Initiative for the community colleges. The initiative is intended to increase access to more online courses created by community college faculty members and to provide students well-designed resources that will improve their chances of a successful learning experience. Part of the work in this initiative is to improve student readiness to engage in the learning experience through online instruction and to provide tutoring support for those students. Those two components have had a successful pilot project “go live” in spring 2015. A common course management system launched among the pilot colleges in fall 2015. Within the initiative are efforts to assist faculty in several professional development ways- creating of online course content, teaching strategies for the online environment, course design standards, and course review training.
Adult Education Initiative
The governor’s initial proposal for the adult education programs to be absorbed into the community colleges met with stiff opposition in the Legislature. A compromise was fashioned to improve and expand the provision of adult education through regional consortia that would eliminate redundancy and craft pathways into higher education for interested students. Instruction in parenting, home economics and classes for older adults were explicitly excluded from this funding. The 2015 AB104 legislation provided a block grant of funds (AEBG) to support action plans to close gaps for adult learners in four
areas: (1) elementary and secondary basic skills; (2) ESL and citizenship for immigrant populations; (3) adults with disabilities; and (4) short-term career and technical education.
Career and Technical Education Initiatives
In 2012 the Legislature passed SB 1402 which the Governor signed to signal intent to recast and rewrite the economic and workforce education division programs and services. The new direction requires industry sector strategies that align collaboratively with labor markets on a regional basis. The Chancellor’s Office translated these policy directions into a four-part initiative called Doing What Matters (DWM) for Jobs and the Economy. Governor Brown has been generous in funding this work and his 2016-17 budget proposals offered $200 million more to expand access to career and technical education as well as to implement new regional accountability structures.
The Silicon Valley schools within the Bay Area Community College Consortium (BACCC) selected the three priority sectors or clusters and two emerging sectors. The priority sectors were (1) Information, Communications, and Technologies; (2) Healthcare; and (3) Advanced Manufacturing. The emerging sectors were (1) Energy, Construction, and Utilities; and (2) Advanced Transportation and Renewables.
The initial phase of DWM was designed to dovetail with the State Workforce Plan created by the California Workforce Investment Board. Some funding from the DWM initiative was awarded to the regions to enhance existing CTE programs and to support regional collaborative work. The second phase of this initiative applies common accountability metrics to gauge the extent to which the efforts have “moved the needle.” A system of common metrics was then developed that includes student momentum points and leading indicators of success. A third phase promotes bringing innovation and best practices to scale. The overriding message of the DWM initiative is to prompt collaborative action within regions to prepare students for work in critical industry sectors.
The 2014-15 State budget provided a one-time pool of $50 million that helped the DWM initiative incentivize the colleges to develop, enhance, retool, and expand CTE offerings in response to regional labor market needs and to stimulate additional regional collaboration. The budget for 2016-17 offers $200 million to be allocated among the regions for the work of preparing students to enter the middle-skills workforce.
In 2013 SB 1070 (California Partnership Academies) was enacted to establish an economic and workforce development program for the community colleges. It requires the Board of Governors, the Chancellor’s Office staff and the colleges to assist economic and workforce regional development centers and consortia to improve, among other things, career-technical education pathways between high schools and community colleges. Contracts and competitive grants funded by the program through 2015 were jointly administered to improve linkages and CTE pathways between high schools and community colleges.
Additional efforts to promote career pathways from high schools to the community colleges were enshrined in the 2014-15 budget as it passed the California Career Pathways Trust Act. Some $250 million was provided in the form of one-time competitive grants. These funds were made available to school districts, county superintendents of schools, directly funded charter schools, regional occupational centers or programs operated by a joint powers authority, and community college districts. The Legislature allocated a second round of funding for the Trust with applications for competitive grants to be implemented in academic years 2015-16 and 2016-17.
The most recent legislation to promote collaboration, AB 288, signed into law on October 8, 2015, authorizes the governance board of a community college district to enter into a College and Career Access Pathways (CCAP) partnership with the governing board of a school district to offer or expand dual enrollment opportunities for students who may not already be college bound or are from underrepresented groups in higher education. The goal is to develop a seamless pathway from high school to community college for career- technical education or preparation for transfer, improving high school graduation rates, or helping high school students achieve college and career readiness.
In November 2015 the Board of Governors culminated a yearlong effort to revisit the ways in which career and technical education was delivered as a means to prepare students for middle skills jobs. The Task Force they commissioned provided 25 recommendations in seven broad areas. Full details are available at http://bit.ly/1lpCGOM. The recommendations are expected to shape policies from the Board of Governors over the next few years.
Dual Enrollment
The most recent legislation to promote collaboration, AB 288, signed into law on October 8, 2015 to take effect in January 2016, authorizes the governing board of a community college district to enter into a College and Career Access Pathways (CCAP) partnership with the governing board of a school district. The partnerships are to offer or expand dual enrollment opportunities for students who may not already be college bound or are from groups underrepresented in higher education. The goal is to develop a seamless pathway from high school to community college for career-technical education or preparation for transfer, improving high school graduation rates, or helping high school students achieve college and career readiness. The following are the highlights of the legislation:
Community colleges can assign priority enrollment and registration to high school students in a CCAP with no fees to pay;
Courses during the regular high school day can be restricted to high school students and do not have to meet the normal open enrollment standard;
Courses with no open seats on campus cannot be offered at high schools through the CCAP;
Basic skills math and English can be offered through CCAP but only for students who are not at grade level in that subject; and
Community colleges can claim FTES if the high school student is qualified for full high school apportionment without using hours of the college course.
Many of the initiatives discussed above have benefited from generous funding associated with the continued recovery of the California economy. Apportionment base funding has been restored, categorical funding has been advanced, and one-time funds have been provided. That funding trend continued into the May 2016 revision of the Governor’s 2016-17 Budget. However, it is believed that the California economy is nearing the point when a normal economic expansion period should end and resources provided should be used to position each college for the future.20
New Growth Funding Formula
Apart from targeted funds described above, the SB 860 legislation from 2014 will impact the allocation of apportionment funds for growth to the districts by using a new formula starting in 2015-16. The legislation directed that growth would be based on each community’s need for access to their community college as determined by local demographics. Need within each district’s official boundaries is to be determined by three primary factors: number of adults within each district who are without a college degree, and the number of individuals who are disadvantaged as evidenced by unemployment and measures of poverty; Pell grant award annual percentage.21 Gavilan College is projected to have a constrained apportionment growth rate of 0.51%.22
Implications for the Colleges:
A broad array of governmental and private organizations is promoting the urgency for postsecondary institutions to produce more graduates. It has been estimated that the State economy will be short in excess of two million graduates with a bachelor’s degree or postsecondary education short of the bachelor’s degree by 2025. As a public agency the College should embrace that public agenda with vigor.
As the federal government seeks to achieve a more balanced budget there is still financial support for students and incentives for institutions to increase student success and prepare more students to compete in a global economy. However, these incentives come with performance expectations. The College may have opportunities to enhance resources and it should act upon those opportunities.
After many years of debate, several federal workforce-training programs have been consolidated and a new direction emphasizing regional efforts and agency collaboration has emerged in the Workforce Innovation and Opportunity Act (WIOA) legislation. As of fall 2016 the Carl Perkins legislation has not yet been reauthorized nor has the Higher Education Act been reauthorized. The College should monitor trends in federal to be in a position to take advantage of any new direction.
![]()
20 Mario Rodriguez, Acting Vice Chancellor for Finance. 2016-17 May Revise Letter to the System.
21 Day Toy, Vice Chancellor for Finance. “Growth Funding Allocation Formula,” Consultation Digest. November 20, 2014. “California Community Colleges Growth Funding Allocation Model” power point presentation to the Association of Chief Business Officers Conference. October 27, 2014.
22 Fred Harris, Vice President for Administrative Services. Gavilan College Budget Workshop 2016-17.
Slide presentation created August 29, 2016
The regional accrediting commission, ACCJC, is following federal direction with requirements it has imposed on member institutions. Recent state legislation intended to induce intentionality into institutional planning and to hold public colleges accountable for performance on state priorities are in a similar spirit to the accreditation expectations. Attention should be given to tracking student achievement and learning performance and acting upon areas were performance does not meet ACCJC expectations.
Starting three years ago State legislation (SB 1440) created a remarkable framework to facilitate transfer to a campus within the California State University (CSU). Community college and CSU faculty throughout the state have risen to the occasion to forge transfer model curriculums (TMCs). Gavilan College achieved its expected target, but there may be more that could be done to facilitate transfer.
Particular state attention has been given to re-crafting matriculation and other student services along the lines of recommendations from the Student Success Task Force. Although matching funds are required, attention must be given to student success concerns. Participating institutions will be required to use a common placement assessment instrument when it is developed if funds are accepted. The College has a series of opportunities to improve services and student success by participating in these new state programs.
A serious revisiting of online instruction as a delivery mode is being funded in the State. While the College has been building an array of online classes, the online education initiative is a promising opportunity in which the College should consider participating.
Adult education has long been neglected as a public service in the state. The AEBG legislation provides fresh funding to promote regional cooperation and elimination of redundancy with incentives to focus the instruction on preparing vulnerable citizens for more effective participation in the workforce. This legislation, combined with the increased funding level for selective noncredit curriculum to equal the level of credit instruction starting in FY 2015-16, presents a unique opportunity to make a very substantial difference in the service area. The College should grasp the opportunity to implement the planning work done by the regional consortium.
Several opportunities are unfolding for career and technical education both within and outside of the Doing What Matters for Jobs and the Economy initiative from the Chancellor’s Office. Several dedicated funding sources are promoting inter-segmental cooperation and regional approaches to this type of instruction. The College should position itself to fully engage the various opportunities in this curriculum.
First Day of Fall Term
Population Served: GCCD Effective Service Area
Within San Benito and Santa Clara Counties, the official boundaries of the District are the areas described in this graphic.
Chart 3: Official Gavilan Community College District Boundaries
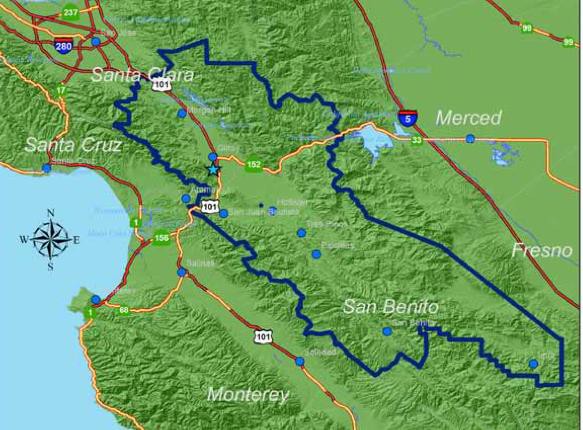
Source: Gavilan College Office of Institutional Research. Factbook, 2012
In 2010 the area population numbered approximately 178,400 people. By 2018 the official District service area population is projected to 189,0709. Although the official District service area includes 12 zip codes, the College has been attracting student enrollments from a wider area.
Effective Service Area
Based upon an analysis of residential zip codes reported by enrolled students over the last five fall terms (2011 to 2015), the effective service area for Gavilan College encompasses 11 cities. Seventy-five percent of the student headcount comes from zip codes that are inside the official District area.
Table 6: In-District vs. Outside-District Origination
Category | 2011 | 2012 | 2013 | 2014 | 2015 | Average |
% In-District | 68.1% | 71.4% | 78.8% | 81.5% | 76.1% | 75.2% |
% Out-of District | 31.9% | 28.6% | 21.2% | 18.5% | 23.9% | 24.8% |
Source: California Community College Chancellor’s Office, MIS Referential Files; analysis by Cambridge West Partnership, LLC
Individuals from the 21 zip codes represented in these areas account for 80% of the students participating at the College in the fall terms from 2011 to 2015.
![]()
![]()
Table 7: Key Zip Codes for Student Origination
Distinct Headcounts, Fall Terms |
| |||||||||||
In- Dist | Zip | City | 2011 | 2012 |
2013 | 2014 | 2015 | 2011 to 2015 % Change | Total | Average | % of Total | Cumula- tive % |
Y | 95020 | Gilroy | 2,374 | 2,172 | 2,167 | 2,167 | 2,242 | -5.6% | 11,122 | 2,224 | 29.9% | 29.9% |
Y | 95023 | Hollister | 2,068 | 1,841 | 1,772 | 1,729 | 1,797 | -13.1% | 9,207 | 1,841 | 24.7% | 54.6% |
Y | 95037 | Morgan Hill | 1,050 | 940 | 885 | 904 | 944 | -10.1% | 4,723 | 945 | 12.7% | 67.3% |
Y | 95046 | San Martin | 198 | 193 | 180 | 166 | 183 | -7.6% | 920 | 184 | 2.5% | 69.8% |
Y | 95045 | San Juan Bautista | 110 | 112 | 109 | 101 | 111 | 0.9% | 543 | 109 | 1.5% | 71.2% |
Y | 95021 | Gilroy | 102 | 114 | 100 | 90 | 98 | -3.9% | 504 | 101 | 1.4% | 72.6% |
Y | 95024 | Hollister | 70 | 73 | 95 | 71 | 69 | -1.4% | 378 | 76 | 1.0% | 73.6% |
95076 | Watsonville | 58 | 51 | 51 | 55 | 66 | 13.8% | 281 | 56 | 0.8% | 74.3% | |
93906 | Salinas | 61 | 35 | 40 | 41 | 60 | -1.6% | 237 | 47 | 0.6% | 75.0% | |
93635 | Los Banos | 40 | 31 | 41 | 53 | 64 | 60.0% | 229 | 46 | 0.6% | 75.6% | |
95123 | San Jose | 50 | 34 | 44 | 42 | 49 | -2.0% | 219 | 44 | 0.6% | 76.2% | |
93907 | Salinas | 27 | 39 | 32 | 40 | 60 | 122.2% | 198 | 40 | 0.5% | 76.7% | |
95110 | San Jose | 31 | 70 | 13 | 35 | 38 | 22.6% | 187 | 37 | 0.5% | 77.2% | |
Y | 95038 | Morgan Hill | 49 | 31 | 27 | 39 | 35 | -28.6% | 181 | 36 | 0.5% | 77.7% |
95004 | Aromas | 35 | 31 | 27 | 30 | 34 | -2.9% | 157 | 31 | 0.4% | 78.1% | |
95111 | San Jose | 21 | 15 | 29 | 30 | 52 | 147.6% | 147 | 29 | 0.4% | 78.5% | |
95127 | San Jose | 25 | 15 | 23 | 32 | 38 | 52.0% | 133 | 27 | 0.4% | 78.9% | |
Y | 95139 | San Jose | 24 | 26 | 20 | 16 | 23 | -4.2% | 109 | 22 | 0.3% | 79.2% |
95008 | Campbell | 24 | 18 | 33 | 13 | 18 | -25.0% | 106 | 21 | 0.3% | 79.5% | |
95122 | San Jose | 16 | 11 | 23 | 20 | 35 | 118.8% | 105 | 21 | 0.3% | 79.7% | |
95112 | San Jose | 13 | 13 | 20 | 28 | 29 | 123.1% | 103 | 21 | 0.3% | 80.0% | |
Source: California Community College Chancellor’s Office, MIS Referential Files; analysis by Cambridge West Partnership, LLC
These zip codes represent a limited number of cities as shown on the following table. Table 8: Key Cities for Student Origination
In-
Distinct Headcounts, Fall Terms
2011 to
2015 %
% of All
Cumula-
Dist City 2011 2012 2013 2014 2015
Change Total Average
Zips Total
tive %
Y | Gilroy | 2,476 | 2,286 | 2,267 | 2,257 | 2,340 | -5.5% | 11,626 | 2,325 | 31.2% | 31.2% |
Y | Hollister | 2,138 | 1,914 | 1,867 | 1,800 | 1,866 | -12.7% | 9,585 | 1,917 | 25.7% | 57.0% |
Y | Morgan Hill | 1,099 | 971 | 912 | 943 | 979 | -10.9% | 4,904 | 981 | 13.2% | 70.1% |
Y | San Martin | 198 | 193 | 180 | 166 | 183 | -7.6% | 920 | 184 | 2.5% | 72.6% |
Y | San Juan Bautista | 110 | 112 | 109 | 101 | 111 | 0.9% | 543 | 109 | 1.5% | 74.1% |
San Jose | 156 | 158 | 152 | 187 | 241 | 54.5% | 894 | 179 | 2.4% | 76.5% | |
Salinas | 88 | 74 | 72 | 81 | 120 | 36.4% | 435 | 87 | 1.2% | 77.6% | |
Watsonville | 58 | 51 | 51 | 55 | 66 | 13.8% | 281 | 56 | 0.8% | 78.4% | |
Los Banos | 40 | 31 | 41 | 53 | 64 | 60.0% | 229 | 46 | 0.6% | 79.0% | |
Aromas | 35 | 31 | 27 | 30 | 34 | -2.9% | 157 | 31 | 0.4% | 79.4% | |
Y | San Jose | 24 | 26 | 20 | 16 | 23 | -4.2% | 109 | 22 | 0.3% | 79.7% |
Campbell | 24 | 18 | 33 | 13 | 18 | -25.0% | 106 | 21 | 0.3% | 80.0% |
Source: California Community College Chancellor’s Office, MIS Referential Files; analysis by Cambridge West Partnership, LLC
Demographic attributes for the effective service area associated with the College are provided in the following table. Population growth between the year 2010 and 2021 for the effective service area is estimated to be 12.6%. The projected annual rate of population growth in the next several years (2016 to 2021) is 1.20%. The median age, in the low to mid-30s, will be relatively young. Household income and home values continue to increase.
Table 9: Effective Service Area Demographics
Gavilan Effective Service Area | 2016 to 2021 | ||||||
Annual Rate | 2000 to 2016 | 2010 to 2021 | |||||
Element | 2000 | 2010 | 2016 | 2021 | of Change | % Change | % Change |
Population | 689,709 | 731,662 | 776,179 | 823,866 | 1.20% | 12.5% | 12.6% |
Group Quarters | 13,532 | ||||||
Households | 200,497 | 217,802 | 228,404 | 242,006 | 1.16% | 13.9% | 11.1% |
Average Household Size | 3.39 | 3.30 | 3.34 | 3.35 | -1.5% | 1.5% | |
Median Age | 33.0 | 33.7 | 34.9 | ||||
Median Home Value | $521,075 | $570,400 | |||||
Median Household Income | $68,630 | $78,400 | |||||
Per Capita Income | $27,547 | $29,991 |
Source: Environmental Systems Research Institute, Demographic and Income Profile and Market Profile; analysis by Cambridge West Partnership, LLC
An extended population projection for the effective service area is illustrated in the following table.
Table 10: Effective Service Area, Extended Population Projections
Extended Population Projection Annual Rate
Area | 2022 | 2023 | 2024 | 2025 | 2026 of | Change |
Gavilan Effective Service Area | 833,752 | 843,757 | 853,883 | 864,129 | 874,499 | 1.20% |
![]()
Source: Environmental Systems Research Institute, Market Profiles; analysis by Cambridge West Partnership, LLC
This larger effective service area is illustrated in the following graphic. Chart 4: Gavilan College Effective Service Area

Source: Environmental Systems Research Institute, Market Profiles; analysis by Cambridge West Partnership, LLC
The three primary individual locations within the District official service area have different rates of growth with Gilroy growing most rapidly, but Morgan Hill is close behind. In fall 2016 residents in both Gilroy and Morgan Hill approved ballot measures designed to limit or slow down growth and to promote a strategy of “in fill” as opposed to sprawl at the edges of each city.
Table 11: Census Place Populations in the District Official Service Area
Population Counts & Projection
2016 to 2021
Annual Rate
Area/Census Place 2000 2010 2016 2021 of Change
Effective Service Area | 689,709 | 731,662 | 776,179 | 823,866 | 1.20% |
Morgan Hill | 33,733 | 37,882 | 43,296 | 47,854 | 2.02% |
Gilroy | 42,560 | 48,821 | 54,338 | 60,959 | 2.33% |
Hollister | 33,954 | 34,928 | 37,627 | 40,059 | 1.26% |
San Martin | 6,504 | 7,027 | 7,372 | 7,775 | 1.07% |
Source: Environmental Systems Research Institute, Market Profiles; analysis by Cambridge West Partnership, LLC
An extended population projection for the three primary places within the District’s
official service area is illustrated on the following table.
Table 12: District Official Service Area Census Places, Extended Population Projections
Extended Population Projection Annual Rate
Area 2022 2023 2024 2025 2026 of Change
Gavilan Effective Service Area | 833,752 | 843,757 | 853,883 | 864,129 | 874,499 | 1.20% |
Morgan Hill | 48,821 | 49,807 | 50,813 | 51,839 | 52,887 | 2.02% |
Gilroy | 62,379 | 63,833 | 65,320 | 66,842 | 68,399 | 2.33% |
Hollister | 40,564 | 41,075 | 45,289 | 45,860 | 46,438 | 1.26% |
San Martin | 7,858 | 7,942 | 8,742 | 8,836 | 8,930 | 1.07% |
Source: Environmental Systems Research Institute, Market Profiles; analysis by Cambridge West Partnership, LLC
The 2006 landmark legislation, AB32, set absolute statewide limits on greenhouse gas emissions and called for local governments to set reduction targets. The 2008 sustainable communities and climate protection act, SB 375, supports the state climate action goals through requirements for coordinated transportation and land use planning to reduce travel demand. In response to these legislative directives the Association of Bay Area Governments (ABAG), Metropolitan Transportation Commission (MTC), Bay Area Air Quality Management District, and the Bay Conservation and Development Commission developed the Plan Bay Area 2040 Preferred Scenario, an update to the work started in 2010, and the Association of Monterey Bay Area Governments (AMBAG) developed in June 2011 the Envisioning the Monterey Bay Area: A Blueprint for Sustainable Growth and Smart Infrastructure Among other things these plans seek to stimulate new residential housing construction to use existing vacant land within existing jurisdictions.
In fall 2016 residents in Morgan Hill and Gilroy restated their interest in managing the rate of housing construction and population increase in those communities by passing measures S and H respectively. In contrast, the City of Hollister had a six-year, state- mandated growth moratorium imposed in 2002 due to shortcomings in the municipal wastewater capacity. Subsequently, the Great Recession from 2008 to 2012 discouraged any residential construction. But, as of 2016 there is a building boom in Hollister as the City has 31 building projects, totaling 2,480 units scattered throughout the City. In addition, the Santana Ranch project for 1,100 homes to be constructed on land just outside the city limits had been previously approved by the County of San Benito. Some 1,200 housing units had been approved for construction in the 1990s but had not been built. The City cannot predict when or to what extent developers will actually construct the homes they have been permitted to complete. 23
Relatively speaking, the cost of housing in the South San Francisco Bay region is high and projected to continue rising with the largest increases predicted for San Benito County.
Table 13: Median Home Values
Median Home Values 2016 vs. 2021
Element 2000 2010 2016 2021 % Change
Effective Service Area | $521,075 | $570,662 | 9.5% | ||
Santa Clara County | $518,241 | $596,708 | $711,608 | $737,942 | 3.7% |
Morgan Hill | $682,519 | $740,011 | 8.4% | ||
Gilroy | $546,188 | $599,542 | 9.8% | ||
San Martin | $837,743 | $874,049 | 4.3% | ||
San Benito County | $342,477 | $288,083 | $468,368 | $521,391 | 11.3% |
Hollister | $374,543 | $432,411 | 15.5% | ||
San Juan Bautista | $587,500 | $689,560 | 17.4% |
Source: Environmental Systems Research Institute, Market Profiles. 2016. California Association of Realtors. 1990-2017 Historic Median Prices of Homes; analysis by Cambridge West Partnership, LLC
Except for Hollister, the majority of owner-occupied homes in all of the other cities within the College service area are valued in 2016 at $400,000 or more.
![]()
23 Cheek, Marty. “Morgan Hill, Gilroy Voters Will Decide Future Growth in Region,” Morgan Hill Life. October 26 and November 8, 2016. Chadwell, John. “City Manager Says New Homes Have Been Planned for Decades,” Benito Link. October 9, 2016. Paxton, Mary. Personal Correspondence. City of Hollister Development Services, November 21, 2016 and Michael Kelly, Personal Correspondence. San Benito County Planning, November 21, 2016
Table 14: 2016 Owner Occupied Housing Unit Values
Value Range
Eff Service Area
2016 Owner Occupied Housing Units by Value Morgan
Hill San Martin Gilroy Hollister
San Juan Bautista
<$50,000 | 3.7% | 2.6% | 2.3% | 3.2% | 4.8% | 0.9% |
$50-$149,999 | 4.8% | 2.3% | 1.2% | 1.3% | 3.7% | 2.9% |
$150-$249,999 | 7.1% | 1.6% | 1.0% | 3.4% | 14.8% | 3.3% |
$250-$399,999 | 17.8% | 7.8% | 2.7% | 17.1% | 31.6% | 23.3% |
$400-$749,999 | 45.5% | 43.9% | 30.8% | 53.5% | 38.2% | 35.0% |
$750-$1M+ | 21.1% | 41.7% | 62.0% | 21.6% | 6.9% | 34.7% |
Source: Environmental Systems Research Institute, Market Profiles; analysis by Cambridge West Partnership, LLC
Within the effective service area 46% of the residents have either less than a high school diploma or only a high school diploma. Another 21% completed some college but did not complete an Associate Degree. Both of these groups of residents are prime candidates for the instruction offered by the College.
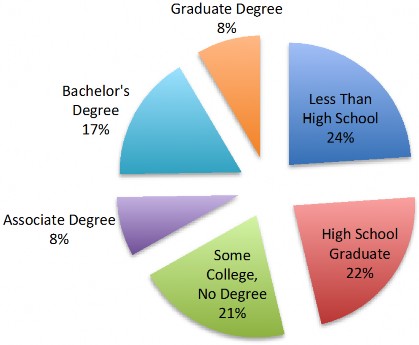
Chart 5: Effective Service Area, Educational Attainment in 2016 for Adults Age 25 or Older
Source: Environmental Systems Research Institute, Market Profile; analysis by Cambridge West Partnership, LLC
The census place locations within the District official service area have different adult educational attainment distributions with the Hollister and Gilroy having the largest portion of adults with less than high school completion attainment.
Table 15: Census Places Adult Educational Attainment, 2016
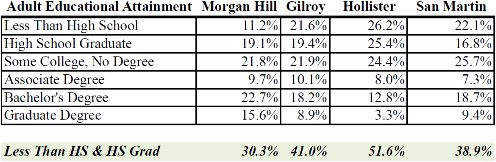
Source: Environmental Systems Research Institute, Market Profile; analysis by Cambridge West Partnership, LLC
In response to the AB86 Adult Education legislation, educational need indicator data was assembled to facilitate adult education program planning in the regional consortia area.
The socio-economic data they received to support planning is displayed in the following table representing the educational needs of the most vulnerable citizens in the larger region.
Table16: Educational Needs of Adults in the Gavilan Regional Consortium for Academic and Career Education Services
AB86 Educational Needs of Adults | ||||||||
ESRI 2014 Data | 5-Yr ACS 2009-2013 Data | |||||||
Regional Consortia | 2014 Regional Population 18 years + | Poverty | No High School Diploma | HS Grad | Some College | Unemploy- ment | Illiteracy | ESL (English Language Learners) |
Gavilan's Regional Consortium | 132,143 | 7,976 | 22,393 | 30,240 | 27,666 | 7,053 | 13,511 | 15,284 |
Percent of 2014 Population | 6.04% | 16.95% | 22.88% | 20.94% | 5.34% | 10.22% | 11.57% | |
Sources: U.S. Census Bureau American Community Survey and U.S. Department of Education, National Center for Educational Statistics- National Assessment on Adult Literacy; analysis by the AB86 Work Group
Compared to San Benito County, the Gavilan College effective service area (ESA) contains slightly more low-income households. Compared to Santa Clara County, the Gavilan ESA contains six percent more low-income households.
Table 17: Comparative Household Incomes
<=$34,999 | 24.9% | 23.7% | 18.5% |
$35-74,999 | 28.3% | 28.5% | 21.5% |
$75-149,999 | 30.8% | 33.3% | 31.6% |
$150,000 + | 16.0% | 14.4% | 28.4% |
Source: Environmental Systems Research Institute, Demographic and Income Profile; analysis by Cambridge West Partnership, LLC
The census places that comprise the District official service area vary in the 2016 household income distributions as illustrated in the following table. Hollister as well as Gilroy have the highest portion (26% and 25% respectively) of households reporting an annual income of less than $35,000.
Table 18: Comparative Household Incomes by City
<=$34,999 | 18.0% | 25.4% | 26.3% | 13.0% |
$35-74,999 | 19.9% | 25.9% | 30.9% | 25.0% |
$75-149,999 | 31.2% | 28.7% | 31.9% | 33.0% |
$150,000 + | 30.9% | 19.9% | 10.9% | 29.0% |
Source: Environmental Systems Research Institute, Demographic and Income Profile; analysis by Cambridge West Partnership, LLC
The Insight Center for Community Economic Development has developed the California Family Economic Self-Sufficiency Standard to quantify the costs of basic needs for California’s working families. The Chancellor’s Office has embraced that standard in its program development work of career and technical education. The Insight Center’s analysis, and that of two other nationally recognized groups, places the annual wage required to sustain a family of four well above a year household income level of $35,000. The most recent calculation of the federal poverty level for a family of four is $24,300.
Table 19: Living Self-Sustaining Household Income Comparisons
MIT Living Wage Calculator | $63,669 | $56,472 |
Insight Center for Community Economic Development | $81,774 | $73,316 |
Economic Policy Center Family Budget Calculator | $84,461 |
*MAGI- modified adjusted gross income
Sources: Massachusetts Institute of Technology. Living Wage Calculator. Retrieved on November 25, 2016 from http://livingwage.mit.edu. Insight Center for Community Economic Development. California Family Economic Self-Sufficiency Standard. . Retrieved on November 25, 2016 from http://www.insightcced.org/tools-metrics/self-sufficiency-standard-tool-for-california/. Economic Policy Institute. Family Budget Calculator. Retrieved on November 25, 2016 from http://www.epi.org/resources/budget/
From the 2010 census to 2021 the age group in the College effective service area that will increase the most (3.4%) in proportion to the overall population is the retirement (65+ age group). The younger career choice group (15-24 age) is projected to decrease the most, 1.9%. Out to 2021, the combined career choice and career start groups are projected to decrease by 1.4%, but will continue to represent a substantial proportion of the overall population.
Table 20: Effective Service Area Age Range Projections
under 15 | 22.6% | 22.1% | 21.1% | -1.5% |
Career Choice (15-24) | 15.5% | 14.6% | 13.6% | -1.9% |
Career Start (25-34) | 14.9% | 15.4% | 15.4% | 0.5% |
Career Middle (35-44) | 14.4% | 13.6% | 14.0% | -0.4% |
Career Finish (45-64) | 23.6% | 23.8% | 23.5% | -0.1% |
Retirement (65+) | 9.1% | 10.7% | 12.5% | 3.4% |
Source: Environmental Systems Research Institute, Market Profile; analysis by Cambridge West Partnership, LLC
The more detailed age table that follows projects that by 2021 high school age students will represent 4% of the population while college-age students will represent 10% of the population in the effective service area. However, over the next five years the proportion of residents in every age will decline slightly.
Table 21: Effective Service Area Detailed Age Range Projections
Effective Service Area Effective Service Area
Age 2010 2016 2021 Average 2010 2016 2021 Average
15 | 10,914 | 10,717 | 11,131 | 32,996 |
16 | 11,392 | 10,669 | 11,105 | |
17 | 11,332 | 10,667 | 11,061 | |
High School Subtotal | 33,638 | 32,053 | 33,297 |
1.5% | 1.4% | 1.4% | 4.3% |
1.6% | 1.4% | 1.3% | |
1.5% | 1.4% | 1.3% | |
4.6% | 4.2% | 4.0% |
18 | 11,717 | 11,248 | 11,612 |
19 | 11,667 | 11,533 | 11,738 |
20-24 | 56,082 | 58,226 | 55,432 |
College Age Subtotal | 79,466 | 81,007 | 78,782 |
1.6% | 1.4% | 1.4% |
1.6% | 1.5% | 1.4% |
7.7% | 7.5% | 6.7% |
10.9% | 10.4% | 9.5% |
79,752
Source: Environmental Systems Research Institute, Market Profile; analysis by Cambridge West Partnership, LLC
10.3%
Hollister and Gilroy reported the largest concentration of individuals in the combined career choice (15-24 age) and career start (25-34) age categories. Morgan Hill reporting the smallest portion of the population in those age categories is not far behind the other two cities. The following table illustrates the distribution of these most likely college- going age groups among the census places within the District official service area is found on.
Table 22: Census Places Age Range Projections
Career Choice & Starter
2016-2021
Absolute
Area/Census Place 2010 2016 2021 Change Average
Effective Service Area | 30.4% | 30.0% | 29.0% | -1.4% | 29.8% |
Morgan Hill | 24.2% | 25.2% | 25.1% | 0.9% | 24.8% |
Gilroy | 28.0% | 28.5% | 27.8% | -0.2% | 28.1% |
Hollister | 29.7% | 30.3% | 29.7% | 0.0% | 29.9% |
San Martin | 26.3% | 24.7% | 23.2% | -3.1% | 24.7% |
Career Choice- ages 15-24 Career Start- ages 25-34
Source: Environmental Systems Research Institute, Market Profile; analysis by Cambridge West
Partnership, LLC
Across the State, participation rates in the community college system are traditionally highest among the younger adults, ages 18 to 24. In recent years 52% of the enrolled students at the College fall into the traditional college-age range of 18 to 24 years of age. The size of that group within the effective service area is critical to future enrollments.
Over a fourteen-year period of time, 1996 to 2010, the College annually enrolled 50 or more students from three high schools that were the primary source of students and 20 to 49 students from three additional high schools. Currently, six comprehensive high schools and three continuation high schools are the primary feeder institutions to the College. The Dr. TJ Owens Early College Academy students are carefully screened for academic potential and as a group far more of those graduates have completed the UC/CSU preparatory courses. These public schools represent three different public school districts distinguished by colors in the following table.
Table 23: College Preparation at Selected Feeder High Schools
2010-1 | 1 Academi | c Year | 2011-12 | Academi | c Year | 2012-13 | Academi | c Year | 2013-14 | Academic | Year | 2014-15 | Academic | Year | |
High School | # Grads | # Grads with UC/CSU Courses | % | # Grads | # Grads with UC/CSU Courses | % | # Grads | # Grads with UC/CSU Courses | % | # Grads | # Grads with UC/CSU Courses | % | # Grads | # Grads with UC/CSU Courses | % |
Gilroy High | 464 | 177 | 38.1% | 313 | 113 | 36.1% | 246 | 96 | 39.0% | 299 | 121 | 40.5% | 235 | 77 | 32.8% |
Christopher High School | 1 | 0 | 0.0% | 245 | 88 | 35.9% | 328 | 105 | 32.0% | 334 | 124 | 37.1% | 412 | 174 | 42.2% |
Dr. TJ Owens Early College Academy | 49 | 1 | 2.0% | 58 | 47 | 81.0% | 38 | 22 | 57.9% | 53 | 45 | 84.9% | 41 | 37 | 90.2% |
Ann Sobrato High | 274 | 1 | 0.4% | 275 | 139 | 50.5% | 306 | 177 | 57.8% | 276 | 155 | 56.2% | 280 | 169 | 60.4% |
Live Oak High | 235 | 66 | 28.1% | 244 | 103 | 42.2% | 251 | 120 | 47.8% | 259 | 163 | 62.9% | 242 | 127 | 52.5% |
San Benito High | 617 | 219 | 35.5% | 592 | 197 | 33.3% | 622 | 238 | 38.3% | 611 | 257 | 42.1% | 648 | 287 | 44.3% |
Subtotal | 1,640 | 464 | 28.3% | 1,727 | 687 | 39.8% | 1,791 | 758 | 42.3% | 1,832 | 865 | 47.2% | 1,858 | 871 | 46.9% |
Mt. Madonna High (Continuation) | 96 | 1 | 1.0% | 127 | 2 | 1.6% | 127 | 1 | 0.8% | 131 | 1 | 0.8% | 125 | 0 | 0.0% |
Central High (Continuation) | 44 | 6 | 13.6% | 59 | 0 | 0.0% | 54 | 0 | 0.0% | 51 | 0 | 0.0% | 39 | 0 | 0.0% |
San Andreas Continuation High | 69 | 0 | 0.0% | 75 | 0.0% | 65 | 0 | 0.0% | 54 | 0 | 0.0% | 55 | 0 | 0.0% | |
Subtotal | 209 | 7 | 3.3% | 261 | 2 | 0.8% | 246 | 1 | 0.4% | 236 | 1 | 0.4% | 219 | 0 | 0.0% |
Total | 1,849 | 471 | 25.5% | 1,988 | 689 | 34.7% | 2,037 | 759 | 37.3% | 2,068 | 866 | 41.9% | 2,077 | 871 | 41.9% |
Source: Gavilan College. Factbook. 2012 and California Department of Education. Data Quest Graduates.
Retrieved November 2, 2016 from http://data1.cde.ca.gov/dataquest/
The long-term projection for high school graduates in San Benito County is a 7% increase between 2013-14 and 2024-25 or a 0.58% annual percentage increase. The corresponding long-term projection in Santa Clara County is only 4.1% between 2013-14 and 2024-25 or a modest 0.34% annual percentage change. At least both projections are in a positive direction.
The largest racial group in the Gavilan effective service areas has been White, but the portion of the self-reported White group is expected to shrink 3.6% by 2021. Conversely, the portion of the self-reported Asian group is anticipated to increase 2.7%.
Hispanic ethnic residents currently constitute 52.1% of the population. The Hispanic ethnic group is estimated to continue increasing by 1.8% between 2016 and 2021 to become 53.9% by 2021.
Table 24: Effective Service Area, Racial and Ethnic Composition
2016 to 2021
Effective Service Area Absolute
Race 2010 2016 2021 Change
White | 50.5% | 48.4% | 46.9% | -3.6% |
Black | 2.5% | 2.5% | 2.5% | 0.0% |
Asian* | 16.2% | 17.6% | 18.9% | 2.7% |
Some Other | 25.6% | 26.1% | 26.2% | 0.6% |
Two or More | 5.2% | 5.5% | 5.6% | 0.4% |
Effective Service Area Ethnicity
Hispanic Origin | 52.1% | 53.0% | 53.9% | 1.8% |
* Also includes American indian and Pacific Islander
Source Environmental Systems Research Institute, Market Profile; analysis by Cambridge West Partnership, LLC
Across the State, participation in the community college system varies among ethnic and racial groups. Statewide, however, young people of Hispanic heritage have been historically underrepresented in higher education.
Implications for the College:
The population in the effective service area is projected to grow with a 12.6% change between 2010 and 2021 or a 1.2% annual change rate between 2016 and 2021, but by 2026 the population is projected to become approximately 874,500. The largest census place within the District official service area, Gilroy, is projected to grow 24.9% between 2010 and 2021 or a 2.33% annual change rate between 2016 and 2021. The College should consider concentrating its outreach and recruiting in Gilroy, although Hollister is more in need of postsecondary education services.
Data assembled for the adult education consortium activities indicate that within the official District service area there are a number of families living at or below the poverty level and a significant segment are English language learners. These data present important outreach implications and opportunities for the College.
Throughout the effective service area, the portion of adult residents age 25 or older that have no high school diploma is 24%. In the largest census place within the District official service area, Gilroy, 21% of the adults have no high school diploma, but an even larger proportion, 26%, in Hollister have less than a high school education. There are ample residents who could benefit by attending the institution and completing a certificate or degree.
Over the next five years the portion of teenagers and very young adults in the effective service area who are making career choices will continue to represent a substantial segment of the population. A limited number of public high schools have been the primary providers of students to the College. These data
underscore the importance of outreach efforts the College might wish to continue in order to sustain enrollment volumes.
In the official District service area 9% of the households reported an income that is below $15,000, another 8% reported income between $15,000 and $24,999. The large portion of low income households and households where English is spoken
less than very well in the College’s official service area provide an opportunity
for the College to be a “merchant of hope” by recruiting students whose lives will be transformed by their success at the institution.
The portion of District residents who self-reported as Hispanic was 53% in 2016 but will only grow to 59% by 2021. In the largest city within the District official service area, Gilroy, the Hispanic group was 58.6% of the population in 2016 and will only grow to 59% by 2020. Traditionally, that group has had a lower participation rate in higher education. These trends present a particular recruiting challenge to the College.

Highway 101 in San Benito County
The Institution from Within
From fall 2000 to fall 2009, the unduplicated student headcount at Gavilan College underwent an increase of 5.9% annually, peaking in fall 2009 (9,411 students) with a total increase of 53% over fall 2000 (3,256 students). The annual unemployment rate in San Benito and Santa Clara Counties had climbed during that period and peaked in 2010 at 26%. From 2007-08 to 2010-11 budget cuts at the state level reduced community college funding by 4%.24
From fall 2010 to fall 2014, the headcount decreased by 25% overall, a decrease of 4.1% annually. Unemployment in both counties declined sharply and enrollments across the state fell drastically during this same time period. In fall 2014 declining enrollments at Gavilan bottomed out at 6,298.
Since fall 2014, unduplicated headcount has been gradually increasing, ending with an unduplicated headcount of 6,886 in fall 2015.
Chart 6: Gavilan Fall Terms, Unduplicated Student Headcount and County Unemployment
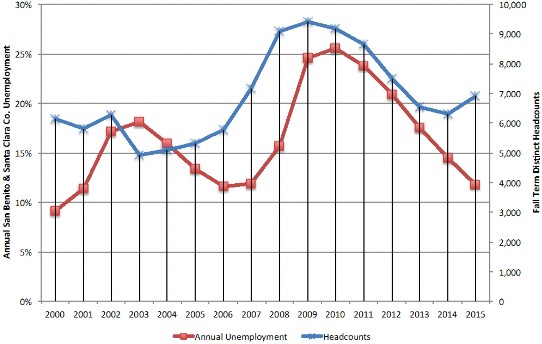
Source: California Community Colleges, Chancellor’s Office, Data Mart. California Employment Development Department, Labor Market Information; analysis by Cambridge West Partnership, LLC.
![]()
24 California Legislative Analyst’s Office. Higher Education Budget in Context. Retrieved January 28, 2017 from http://www.lao.ca.gov/analysis/2011/highered
This same trend in declining headcount after fall 2009 was also experienced in neighboring California community colleges. As of fall 2014, all except one of the colleges, Hartnell, had not regained student headcount. Foothill, Gavilan, and Mission were beginning to see modest increases in headcount after 2014.
Chart 7: Gavilan and Neighboring Colleges Fall Term Unduplicated Student Headcount
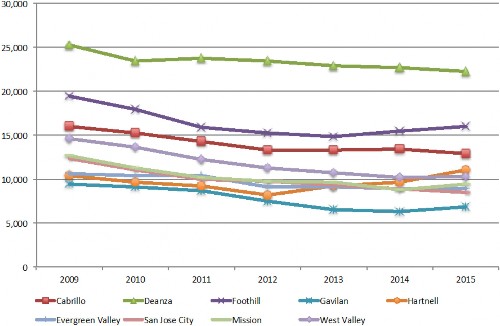
Source: California Community Colleges, Chancellor’s Office, Data Mart; analysis by Cambridge West Partnership, LLC.
From 2009-10 to 2015-16 the annual Full-time Equivalent Students (FTES) produced at Gavilan decreased by 490 FTES, a decrease of 8.1%. All of the neighboring colleges, except Hartnell, experienced a more dramatic decrease.
Chart 8: Gavilan and Neighboring Colleges Annual Credit FTES Trends
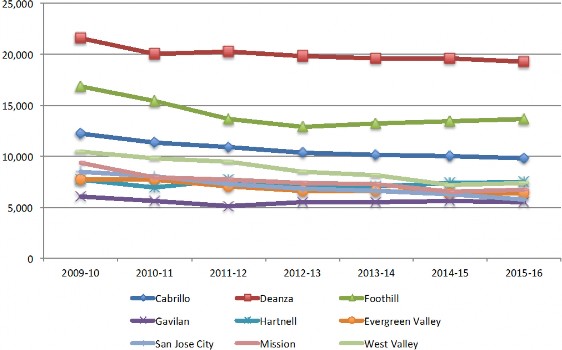
Source: California Community Colleges, Chancellor’s Office, Data Mart; analysis by Cambridge West Partnership, LLC.
Additional analysis of these trends is available in the GAVData, interactive Fact Book, produced by the College Office of Institutional Research or at the Office web page http://www.gavilan.edu/about/research/data.php under basic college facts.
All colleges in the region have experienced some enrollment outflow of residents in their districts attending another college. The research staff at the California Community Colleges Chancellor’s Office has provided a swirl analysis for the fall terms of 2013 and 2014. Some students from out of the district area are enrolled in online courses offered by the College. A portion of that analysis is shown in the following table.
Table 25: South San Francisco Bay Enrollment Outflow
Fall 2013 & 2014 Fall 2013 & 2014
District In District Nbr. In District % Out District Nbr.* Out District % Total
CABRILLO | 23,072 | 86% | 3,737 | 14% | 26,809 |
FOOTHILL-DEANZA | 26,940 | 35% | 48,968 | 65% | 75,908 |
GAVILAN | 10,366 | 81% | 2,483 | 19% | 12,849 |
HARTNELL | 15,125 | 80% | 3,740 | 20% | 18,865 |
SAN JOSE-EVERGREEN | 31,879 | 88% | 4,377 | 12% | 36,256 |
WEST VALLEY-MISSION | 25,549 | 65% | 13,773 | 35% | 39,322 |
Region Total 132,931 63% 77,078 37% 210,009
Source: California Community Colleges, Chancellor’s Office. Research, Analysis and Accountability Unit; analysis by Cambridge West Partnership, LLC.
The College has offered some unique programs of study that have been “magnets” to attract students The Joint Powers Agreement for public safety curriculum and apprenticeship curriculum offerings account for 74% of the out-of-district enrollments in fall 2015. The subjects that attracted the most out-of-district enrollments are documented in the following table.
Table 26: Fall 2015, Gavilan Enrollments from Out-of-District California Regions
CARP | 684 | 2 | 35 | 32 | 3 | 611 | 1 | |
JLE | 539 | 11 | 71 | 55 | 161 | 21 | 170 | 50 |
DRLT | 298 | 35 | 6 | 255 | 2 | |||
ENGL | 165 | 1 | 37 | 1 | 5 | 1 | 119 | 1 |
JFT | 144 | 3 | 6 | 10 | 52 | 8 | 62 | 3 |
CSIS | 143 | 2 | 24 | 4 | 4 | 5 | 89 | 15 |
ATH | 139 | 26 | 6 | 107 | ||||
MATH | 129 | 22 | 2 | 2 | 1 | 101 | 1 |
Source: California Community Colleges, Chancellor’s Office. MIS Referential Files; analysis by Cambridge West Partnership, LLC.
Conversely, some programs of study offered by other community colleges or the location convenience of the other college to the student’s place of employment may be causing students living in the Gavilan College official district area to attend classes at another institution. The closest colleges to Gavilan, Evergreen Valley and San Jose City, are north via highway 101. The subjects offered by those two colleges that attracted the most Gavilan residents in fall 2013 are illustrated in the following table.
Table 26: Fall 2013, Gavilan District Residents Enrolled at San Jose-Evergreen CCD
Fall 2013 Gavilan Enrollment (Seat Counts) Counts in SJECCD
Coyote
Gilroy Hollister Morgan Hill
Paicines
San Juan Bautista
San Martin
San Jose
Subj Total 95013 95020 95021 95023 95024 95037 95038 95043 95045 95046 95138 95139
ENGL | 338 | 1 | 53 | 1 | 23 | 2 | 112 | 1 | 1 | 12 | 106 | 26 | |
MATH | 266 | 1 | 45 | 21 | 79 | 1 | 13 | 83 | 23 | ||||
HIST | 132 | 21 | 1 | 7 | 42 | 2 | 2 | 8 | 35 | 14 | |||
PSYCH | 123 | 1 | 15 | 8 | 39 | 1 | 4 | 36 | 19 | ||||
COMS | 105 | 1 | 17 | 3 | 1 | 36 | 1 | 1 | 2 | 34 | 9 |
Source: California Community Colleges, Chancellor’s Office. MIS Referential Files; analysis by Cambridge West Partnership, LLC.
The College operates two satellite centers to accommodate residents who live in Hollister and Morgan Hill and may not find it convenient to travel to the main campus located in Gilroy. However, in the baseline term for this Plan, fall 2015, 1,866 individuals living in Hollister enrolled at the College. Of those, 1,233 (66%) did make the journey to the main campus. The following table reflects the enrollments in the most popular subjects in which they enrolled.
Table 27: Fall 2015, Hollister Residents Enrollments in Classes at the Main Campus
Division Description Department Description Subject Nbr Enrls % of Total Enrl.
Liberal Arts and Sciences | Natural Sciences & Math | MATH | 390 | 12.4% |
Liberal Arts and Sciences | English | ENGL | 324 | 10.3% |
Kinesiology | Kinesiology | KIN | 240 | 7.6% |
Counseling and Guidance | Counseling | GUID | 140 | 4.4% |
Liberal Arts and Sciences | Natural Sciences & Math | BIO | 135 | 4.3% |
Liberal Arts and Sciences | Fine Arts | CMUN | 132 | 4.2% |
Liberal Arts and Sciences | Fine Arts | ART | 113 | 3.6% |
Disability Resource Center | Disability Resource Center | DRCGUID | 97 | 3.1% |
Subtotal of Above Enrollments 1,571
Total Enrollments 3,151
Source: Gavilan College, Office of Institutional Research; analysis by Cambridge West Partnership, LLC
In the baseline term for this Plan, fall 2015, 979 individuals living in Morgan Hill enrolled at the College. Of those, 714 (73%) did make the journey to the main campus. The following table reflects the enrollments in the most popular subjects in which they enrolled.
Table 28: Fall 2015, Morgan Hill Residents Enrollments in Classes at the Main Campus
Division Description Department Description Subject Nbr Enrls. % of Total Enrl.
Liberal Arts and Sciences | Natural Sciences & Math | MATH | 197 | 10.8% |
Liberal Arts and Sciences | English | ENGL | 177 | 9.7% |
Kinesiology | Kinesiology | KIN | 110 | 6.0% |
Liberal Arts and Sciences | Fine Arts | CMUN | 97 | 5.3% |
Counseling and Guidance | Counseling | GUID | 89 | 4.9% |
Liberal Arts and Sciences | Fine Arts | ART | 87 | 4.8% |
Liberal Arts and Sciences | Social Sciences | HIST | 78 | 4.3% |
Liberal Arts and Sciences | Social Sciences | PSYC | 71 | 3.9% |
Career Technical Education | Business | CSIS | 65 | 3.6% |
Disability Resource Center | Disability Resource Center | DRCGUID | 61 | 3.3% |
Liberal Arts and Sciences | Natural Sciences & Math | BIO | 58 | 3.2% |
Disability Resource Center | Disability Resource Center | AE | 55 | 3.0% |
Liberal Arts and Sciences | Social Sciences | SOC | 55 | 3.0% |
Subtotal of Above Enrollments 1,200
Total Enrollments 1,822
Source: Gavilan College, Office of Institutional Research; analysis by Cambridge West Partnership, LLC

Gavilan College Athletics Program Mascot
In recent years the College has increased its outreach efforts with the local high schools. From fall 2011 to fall 2015 the fall term and average yield rates are shown in the following table. The yield is calculated from the count of graduates (denominator) divided into the count of students who enroll at the College the following fall (numerator).
Table 29: High School Yield Rates
Gilroy USD | Average | |||||
2011 | 2012 | 2013 | 2014 | 2015 | ||
Gilroy High | 25% | 20% | 27% | 45% | 41% | 32% |
Christopher High | 24% | 39% | 4% | 13% | 20% | |
Mt. Madonna High (Continuation) | 15% | 9% | 17% | 18% | 18% | 15% |
Dr. TJ Owens Gilroy Early College Academy | 29% | 9% | 3% | 25% | 17% | 16% |
Morgan Hill USD | ||||||
2011 | 2012 | 2013 | 2014 | 2015 | ||
Live Oak High | 15% | 16% | 17% | 18% | 30% | 19% |
Ann Sobrato High | 8% | 13% | 11% | 14% | 23% | 14% |
Central High (Continuation) | 7% | 12% | 4% | 0% | 8% | 6% |
San Benito HSD & Aromas-San Juan USD | ||||||
2011 | 2012 | 2013 | 2014 | 2015 | ||
San Benito High | 25% | 19% | 26% | 30% | 23% | 25% |
San Andreas High (Continuation) | 22% | 7% | 9% | 13% | 11% | 12% |
Anzar High | 11% | 10% | 26% | 31% | 18% | 19% |
Source: California Department of Education. California Community Colleges, Chancellor’s Office. MIS Referential Files; analysis by Cambridge West Partnership, LLC.
The community colleges are the main point of access to higher education in the state of California. Collectively they have been serving approximately 75% of the public undergraduate college enrollment in the state. The Great Recession had a significant impact on the ability of the system to serve those who needed access to the academic and vocational program offerings. Between 2009-10 and 2014-15, the system-wide participation rate dropped from 84.3 to 73.3 per 1,000 adults. Gavilan College has had a similar experience with respect to the participation rate from cities and census-designated places within the district service area. However, the College has come back with strong participation from the larger communities in the official service area.
Table 30: Participation Per 1,000 Adults
Gilroy | Santa Clara | 93.37 | 113.75 | 144.57 |
Hollister | San Benito | 107.20 | 134.37 | 168.09 |
Morgan Hill | Santa Clara | 59.93 | 72.18 | 71.84 |
San Jose (2 zips) | Santa Clara | 4.17 | 4.66 | |
San Juan Bautista | San Benito | 151.30 | 145.35 | 163.82 |
San Martin | Santa Clara | 85.70 | 63.08 | 75.84 |
Total | 88.97 | 88.01 | 106.00 | |
System-wide | 103.38 | 84.30 | 73.30 |
Source: U.S. Census American Fact Finder. Environmental Systems Research Institute (ESRI). California Community Colleges, Chancellor’s Office. MIS Referential Files; analysis by Cambridge West Partnership, LLC.
From fall 2009 to fall 2015 the College has had to reduce the numbers of classes scheduled at the Hollister and Morgan Hill satellite locations as well as off-campus in general. Noncredit FTES has been the strongest in off-campus locations, but those offerings were curtailed based upon policy direction from the Chancellor’s Office. In the following table the count of sections does not considered combined classes where multiple sections are taught on the same day pattern in the same room at the same time. Those sections were counted individually
Table 31: Schedule and FTES Trends by Location Fall 2009-2015
Fall 2009 | Fall 2011 | Fall 2013 | Fall 2015 | Average | 2009 vs 2015 % Change | |||||||
Location | # Sect. Enrl | # Sect. Enrl | # Sect. Enrl | # Sect. Enrl | # Sect. Enrl | # Sect. Enrl | ||||||
Aviation | 4 | 41 | ||||||||||
Gilroy | 551 | 12,984 | 567 | 13,986 | 553 | 10,754 | 571 | 12,286 | 560.50 | 12,502.50 | 4% | -5% |
Hollister | 53 | 962 | 59 | 1,170 | 63 | 1,119 | 40 | 980 | 53.75 | 1,057.75 | -25% | 2% |
Morgan Hill | 53 | 1,098 | 64 | 1,133 | 59 | 1,001 | 40 | 960 | 54.00 | 1,048.00 | -25% | -13% |
Off Campus | 224 | 6,387 | 151 | 5,341 | 163 | 6,373 | 206 | 8,257 | 186.00 | 6,589.50 | -8% | 29% |
San Benito | 2 | 17 | ||||||||||
Total | 885 21,472 | 841 | 21,630 | 840 | 19,264 | 857 | 22,483 | 855.75 | 21,212.25 | -3% | 5% | |
Full-time Equivalent Students | Average | 2009 vs 2015 % Change | ||||||||||
Location Credit Non Cr. | Credit Non Cr. | Credit Non Cr. | Credit Non Cr. | Credit Non Cr. | Credit Non Cr. | |||||||
Aviation | 20.17 | |||||||||||
Gilroy | 1,701.20 | 113.85 | 1,655.33 | 100.58 | 1,598.15 | 78.45 | 1,581.25 | 38.16 | 1,633.98 | 82.76 | -7% | -66% |
Hollister | 125.56 | 4.15 | 143.94 | 7.10 | 121.82 | 11.17 | 98.06 | 9.57 | 122.35 | 8.00 | -22% | 131% |
Morgan Hill | 134.72 | 6.85 | 133.65 | 7.87 | 115.39 | 6.59 | 102.37 | 8.97 | 121.53 | 7.57 | -24% | 31% |
Off Campus | 287.07 | 187.38 | 352.06 | 143.51 | 208.89 | 147.73 | 342.13 | 144.60 | 297.54 | 155.81 | 19% | -23% |
San Benito | 2.28 | |||||||||||
Total 2,268.72 312.23 | 2,284.98 | 259.06 | 2,046.53 | 243.94 | 2,123.81 | 201.30 | 2,181.01 | 254.13 | -6% | -36% | ||
Source: Gavilan College Office of Institutional Research; analysis by Cambridge West Partnership, LLC
Current Program of Instruction
The fall 2015 program of instruction was used as a baseline to define the needs for instructional and student support space. The detailed analysis of the projected program of instruction is located in the Projections for Future Growth chapter of this plan. The available instructional space determines the institution’s capacity to produce weekly student contact hours (WSCH).
At the start of the 2016-17 academic year, the College was authorized to offer 138 credit instructional programs (degrees and certificates). Twenty-one of these approved programs are new transfer model curriculum degrees. Ten of these new transfer degrees are in fields of study previously approved as associate degrees. There are 20 degrees offered in disciplines that are considered within the liberal arts areas but are not duplicative of the associate degrees for transfer. The College has established 14 certificates of achievement in traditional liberal arts fields of study.
The remaining degrees and certificates are in disciplines that are considered career and technical education. Of these programs, 34 culminate in the award of an associate degree while 40 culminate in the award of a certificate of achievement.
Overall forty of the associate degrees offer certificates of achievement in the same field of study; the students may choose to earn both. Thirteen of the programs of study offer two different associate degrees in the same field of concentration.
The College offers several programs that are accredited by county, state or federal agencies, while others are accredited by national professional associations. The Federal Aviation Administration accredits the Aviation Technology programs. The California Board of Registered Nursing accredits the Associate Degree Nursing program and the California Board of Vocational Nursing and Psychiatric Technicians accredits the Licensed Vocational Nursing program. Through a Joint Powers Agreement and the South Bay Regional Public Safety Training Consortium, the
California State Fire Marshal accredits the fire academy and advanced fire technology courses.
Peace Officer Standards and Training (POST) Commission accredits the law enforcement academies and advanced courses.
Board of State and Community Corrections, Standards and Training for Corrections (STC) accredits the corrections academy and advanced courses.
Additionally, the Board of Trustees has authorized the College to award 15 Certificates of Proficiency that require less than 18 units of credit. By state policy those certificates are not entered on the students’ transcripts upon completion. Also, the Chancellor’s Office has authorized three non-credit certificate programs.
In fall 2015 the College submitted a substantive change proposal to the regional accrediting agency, Accrediting Commission for Community and Junior Colleges (ACCJC). In February 2016 the Commission approved 41 associate degrees and 38 certificate programs to be offered where fifty percent or more of the curriculum was delivered via distance education or electronic delivery.
When compared to colleges producing a comparable volume of FTES, Gavilan appears to be offering a broader range of programs of study than all but one of its peers. Among the four peer institutions only Cuyamaca College offers slightly more degrees and certificates. The count of Taxonomy of Programs (TOPs) data is an expression of the number of different disciplines provided in the degree and certificate programs of study. Including non-credit offerings, the efforts by Gavilan cover a wider range of disciplines than any of its peer institutions. Supporting this variety of instructional programs and disciplines may be difficult. The counts of degrees shown in the following table have been adjusted to remove duplicates when an associate degree for transfer has been implemented.
Table 32: Comparative Breadth of Curriculum Programs of Study
Napa Valley | 2,703.72 | 82 | 24 | 58 | 4 | 44 |
Yuba | 2,622.95 | 109 | 43 | 66 | 56 | |
San Jose City | 2,618.60 | 112 | 57 | 55 | 41 | |
Gavilan | 2,590.84 | 138 | 54 | 84 | 3 | 64 |
Cuyamaca | 2,476.40 | 146 | 55 | 91 | 58 |
Sources: California Community Colleges Chancellor’s Office. Data Mart and Curriculum Inventory.
Retrieved December 24, 2016 from http://datamart.cccco.edu and http://curriculum.cccco.edu
At the beginning of the 2016-17 academic year Gavilan College had established 22 Associate Degrees for Transfer (AD-T). The College is in the top group of community colleges in the numbers of these AD-T programs it has implemented. The College has submitted a program in Biology and a second in Elementary Teacher Education. The
College’s standing in the state as of the spring 2017 term is documented in the following table.
![]()
![]()
![]()
Table 33: State Summary of Associate Degrees for Transfer, December 2016
Quartile | Category | Nbr. Colleges |
4th | 22 to 28 degrees (Gavilan) | 28 |
3rd | 19 to 21 degrees | 26 |
2nd | 15 to 18 degrees | 27 |
1st | 5 to 14 degrees | 32 |
| Total | 113 |
![]()
![]()
Source: California Community Colleges, Chancellor’s Office, Academic Affairs Division, Transfer Model Curriculum AD-T Progress Report, September 28, 2016 and Curriculum Inventory; analysis by Cambridge West Partnership, LLC
Of the 932 possible courses listed in the College curriculum inventory, 181 have been named in these 21 transfer degree programs. The courses required or named as restricted electives in these transfer degree programs must be offered at least once in a two-year cycle. There are scheduling implications associated with the institutional commitment to sponsor so many AD-T degrees. Most courses were identified in only one transfer degree program; however, a limited number of courses were identified in more than two AD-Ts as illustrated in the following table.
Table 34: High Frequency Named Courses in Associate Degrees for Transfer
MATH5* | Introduction to Statistics | 7 |
SOC1A* | Introduction to Sociology | 4 |
MATH1A | Single Variable Calculus & Analytic Geometry | 4 |
MATH1B | Single Variable Calculus & Analytic Geometry | 4 |
ANTH3* | Introduction to Cultural Anthropology | 4 |
ART1A* | Art History | 3 |
ART1B* | Art History | 3 |
ART8A | Introduction to Photography | 3 |
ENGL1C* | Critical Reasoning and Writing | 3 |
MATH1C | Multivariable Calculus | 3 |
PHYC10 | Introduction to Psychology | 3 |
*course is offered both online and face-to-face on campus
Source: Gavilan College. 2015-17 Catalog; analysis by Cambridge West Partnership, LLC
The fall 2015 program of instruction on the main campus in Gilroy consisted of 505 sections (considering a set of combined classes as one class), which generated 1,677 credit full-time equivalent students (FTES). Off campus classes accounted for 206 sections and 342 FTES. The satellite location at Hollister hosted 39 sections with 84
FTES generated. The Morgan Hill satellite location offered 38 sections and generated 92 FTES. Miscellaneous off site/off campus locations accounted for 158 sections and generated 428 FTES.
The divisions of the College determined percentage shares of the WSCH attendance at the main campus in Gilroy. Two divisions account for the largest portions of WSCH in the fall 2015 program of instruction: (1) Liberal Arts and Science (56%) and (2) Career & Technical (26%). The key characteristics of the fall 2015 program of instruction are reflected in the following table. Combined class sections were considered in this analysis. Apprentice instruction does not generate WSCH or apportionment, but the sections were included.
Table 35: Fall 2015 Key Measures for the Program of Instruction
Counseling | 535 | 1% | 25 | 5% |
Career & Technical | 12,475 | 24% | 118 | 23% |
Disability Resource Center | 2,078 | 4% | 34 | 7% |
Kinesiology & Athletics | 4,148 | 8% | 34 | 7% |
Liberal Arts & Sciences | 32,289 | 62% | 279 | 55% |
Non-Credit | 576 | 1% | 15 | 3% |
Source: Gavilan College, Office of Institutional Research, analysis by Cambridge West Partnership, LLC
During the fall 2015 baseline term the College offered 416 different courses. Among the 416 courses, 31 of them accounted for fifty percent of all. Those 31 courses represent 17 different subjects, but the two subjects with the largest enrollments were Math (6 courses) and English (4 courses). The fall schedule reflected 54 different subjects, six of which captured fifty percent of all enrollments. These large enrollment subjects were LIB, ENGL, MATH, GUID, KIN, and CARP.
Scheduling classes at a large, complex institution such as Gavilan College is a significant juggling act to balance facilities, faculty, weeks-duration, days, and time slots. It is particularly challenging to orchestrate coordinated time periods for classes with different numbers of contact hours and classes that run for different numbers of weeks. Also, some classes are offered to address the needs of cohorts of learners in special programs and others are offered off site and not on the main campus. Many of the conflicts identified in the following discussion flow from conflicts among these variables.
An analysis of the instructional periods used in the fall 2015 schedule was limited to the classes scheduled in a fixed pattern on the main campus in Gilroy. There were six primary instructional periods related to the common two-day-a-week day scheduling pattern (starting before 4:30 pm). However, 27% of classes were scheduled at starting and ending times that conflicted with these primary instructional periods.
Twelve classes were scheduled to meet two days a week, but the day patterns differed from the more common Monday and Wednesday or Tuesday and Thursday pattern. In addition, all of those classes had starting times that varied from the six primary instructional periods.
An additional 91 sections were scheduled on three or more days per week, but 56% of those classes were also scheduled at starting times that conflicted with the six primary instructional periods.
Some of this potential conflict may have arisen from the differences in contact time required by courses with different units of credit and different combinations of lecture and laboratory modes of instruction.
The following tables illustrate the fall 2015 term patterns and potential conflicts on the main campus at Gilroy.

Ribbon Cutting for the New Aviation Maintenance Program Facility in San Martin
Table 36: Gilroy Main Campus Day Schedule Pattern Analysis, Fall 2015
1 2 3 4 5 6 | starts <8:10 am, ends odd | 3 | 1 | 4 |
8:10-9:30 am | 13 | 17 | 30 | |
starts between 8:10-9:30 am, ends odd | 5 | 10 | 15 | |
9:45-11:05 am | 26 | 27 | 53 | |
starts between 9:16-11:19 am | 0 | 1 | 1 | |
11:20 am-12:40 pm | 25 | 25 | 50 | |
starts at 11:10-12:50 am, ends odd | 10 | 8 | 18 | |
12:50-2:10 pm | 23 | 11 | 34 | |
starts between 12:50-2:29 pm | 0 | 14 | 14 | |
2:30-3:50 pm | 13 | 5 | 18 | |
starts between 2:30-3:30 pm, ends odd | 11 | 7 | 18 | |
4:00-5:20 pm | 5 | 4 | 9 | |
starts between 4:00-4:29 pm | 0 | 3 | 3 |
Period
Totals | 134 | 133 | 267 |
Percent in the primary periods | 78.4% | 66.9% | 72.7% |
Percent out of the primary periods | 21.6% | 33.1% | 27.3% |
Day Classes, Scheduled Multiple Days Per Week
MF | MT | WTh | FSa | MTTh | MTThF | MTW | MTWTh | MWTh | MTWThF | MWF | TWTh | TWThF | WThF | Subtotal | |
3 | 1 | 1 | 4 | 1 | 10 | ||||||||||
1 2 3 4 5 6 | 1 | 2 | 2 | 1 | 1 | 7 | |||||||||
3 | 2 | 4 | 12 | 21 | |||||||||||
4 | 3 | 3 | 10 | ||||||||||||
1 | 1 | 1 | 3 | 1 | 1 | 8 | |||||||||
4 | 3 | 7 | |||||||||||||
1 | 1 | 2 | |||||||||||||
1 | 2 | 6 | 9 | ||||||||||||
1 | 1 | 1 | 2 | 5 | |||||||||||
1 | 1 | 2 | |||||||||||||
1 | 1 | 2 | |||||||||||||
3 | 2 | 5 | |||||||||||||
1 | 2 | 3 | |||||||||||||
1 | 7 | 3 | 1 | 1 | 2 | 1 | 23 | 0 | 10 | 21 | 3 | 17 | 1 | 91 | |
Percent in the primary periods 44.0%
Percent out of the primary periods 56.0% Source: California Community Colleges, Chancellor Office, Data on Demand Fall 2015 MIS Referential File XF, Sessions; analysis by Cambridge West Partnership, LLC
Classes scheduled to meet only one day a week during the prime instructional morning hours create potential conflicts in room utilization and student schedules. In fall 2015 there were 49 classes scheduled in that manner as summarized in the following table. Classes scheduled to meet one day a week in the afternoon are less problematic.
Table 37: Gilroy Main Campus Morning One Day A Week Morning Classes, Fall 2015
One-Day-A-Week Starting in the Prime AM Hours (up to noon)
Monday Tuesday Wednesday Thursday Subtotal Friday Saturday Total
![]()
9 12 16 12 49 35 2 86
18% 24% 33% 24% 100%
Source: California Community Colleges, Chancellor Office, Data on Demand Fall 2015 MIS Referential File XF, Sessions; analysis by Cambridge West Partnership, LLC
Evening classes, those starting at 4:30 pm or later, which were scheduled to meet two- days-a-week, showed less variety of starting and ending times as well as day patterns. Sixty-nine percent were offered during the primary two evening periods meeting two days per week. However, another seven classes were scheduled to meet multiple days a week in the evenings and 86% of those were starting at times other than the two primary evening instructional periods. Most evening classes met one evening per week and all of them conformed to the established two evening instructional period starting times.
Table 38: Gilroy Main Campus Evening Schedule Patterns Analysis, Fall 2015
Evening Classes, Scheduled Two Days Per Week
Period # Start Times
Monday and Wednesday
Tuesday and
Thursday Total
7 8 | starts between 4:30-5:59 pm, ends odd | 5 | 5 | |
6:00 PM | 5 | 6 | 11 | |
6:30 PM | 0 |
Total | 5 | 11 | 16 |
Percent in the primary periods | 100.0% | 54.5% | 68.8% |
Percent out of the primary periods | 0.0% | 45.5% | 31.3% |
Classes Scheduled One-Day-A-Week in the Evening (start after 4:29pm)
6:00 PM | 14 | 11 | 13 | 11 | 49 | |
6:30 PM | 1 | 3 | 2 | 3 | 9 |
Period # Start Time Monday Tuesday Wednesday Thursday Total 7
8
Total 15 14 15 14 58
Source: California Community Colleges, Chancellor Office, Data on Demand Fall 2014 MIS Referential File XF, Sessions; analysis by Cambridge West Partnership, LLC
The College may want to consider a more detailed study of the classes that are scheduled to start or end at times other than the primary day instructional periods and use day patterns that are off the core rhythm of the schedule. There may be merit in attempting to craft a common passing time during the prime morning hours. If conflicts among class meeting times were reduced, it would provide students with greater access to instruction they need to complete their programs of study. In addition, it may be useful to make additional inquiries about those five classes that meet in the evening hours, but vary in their starting times and day patterns, to determine if potential class conflicts might be reduced.
In fall 2016, the Gavilan College Office of Institutional Research conducted a survey with the goal of understanding students’ schedule preferences at the College. The survey garnered 244 responses, and its findings were deemed to be representative of the student population as a whole, with a reasonable level of confidence.
The survey’s findings demonstrate a sizable level of dissatisfaction among students regarding their ability to schedule their preferred or necessary classes at times that are convenient for them. The majority of students (60%) is generally less than satisfied with the times that courses are scheduled at the College, and slightly more students (67%) reported that the courses they need to take are offered at times unavailable to them, and thus they end up taking other classes.
While some students choose to settle for courses at Gavilan that were less directly related to their program of study, others (10% of students) opt to take necessary classes elsewhere instead of at Gavilan. Of these students taking classes at other colleges, 81% of them do so because the courses necessary for their program of study are unavailable at Gavilan. Assuming the numbers are representative of the student population, the survey report calculated that if the College were able to capture all of these students by offering their necessary courses at appropriate times, it could generate over 200 FTES more in the fall alone.
The survey prompted students about several possibilities to increase schedule flexibility in the future, including classes at satellite campuses and at different times of the day or week. When asked about the newly constructed Coyote Valley satellite campus, most students (75%) had not heard of this satellite location, but half of the students said that they might be or would be interested in taking classes there. Of this half, about 50% are interested in taking science, math and CTE classes at the Coyote Valley satellite location, while about 33% are interested in taking social studies, fine arts, or English courses there.
Regarding changing the times courses are offered, 75% of students reported that they would take shorter courses that convened three or four times a week, rather than the current twice-a-week longer courses. Seventy percent of the students showed interest in taking night classes, and about 60% expressed interest in taking weekend classes.
Additionally, around 65% of students showed interest in signing up for a degree earned through night and weekend classes only.25 Students were not asked to express an interest in distance education.
The College has offered classes in multiple formats in an effort to provide access to students who otherwise would not be able to attain a college education. In addition to traditional face-to-face classes, the College offers courses online, and has offered classes in a hybrid format. In spring 2016, the Accrediting Commission for Community and Junior Colleges (ACCJC) approved the College’s substantive change proposal. That proposal authorizes the College to offer a variety of degrees and certificates where at
![]()
25 Wruck, Peter, Director of the Office of Institutional Research, Gavilan College. Student Scheduling Preferences Survey: Findings Report. December 1, 2016
least 50% of the required courses are available online. A listing of those degrees and certificates is found in Appendix C of this Plan.
Specialized professional development, provided to assist faculty members who want to teach online classes, addresses the mechanics of the College online software environment and best practices techniques for course design and pedagogy for distance learning. All faculty members teaching in the online environment for the first time must complete that professional development. The College has a full-time distance education coordinator who offers workshops and one-on-one assistance to faculty teaching online. Over the last two years, small cohorts of faculty have completed the Title V grant-funded Gavilan Online Teacher Training (GOTT) Academy. They also serve as resources to other faculty just starting to teach in the online environment.
The College has adopted the Canvas learning management system (LMS) recommended by the state Online Education Initiative (OEI) and is providing assistance to faculty members in converting their materials to the new LMS. The College had been using the Moodle LMS and creating a “shell” for all classes to use as a venue for course resources. The practice of creating a “shell” for all classes will continue when Canvas is fully implemented and all faculty members can use Canvas as a venue for course resources.
Gavilan College Leadership Group, Spring 2017
350
300
300
272
262
264
238
243
237
250
226
200
150
100
50
0
2009
2010
2011
2012
2013
2014
2015
2016
Over the past eight years, online FTES has increased by 10%. Chart 9: Annual FTES Trends from Online Classes
Source: Gavilan College, Office of Institutional Research
Students Who Attend the College
The Director of Institutional Research has developed a very sophisticated, interactive, web-based Fact Book that provides many details about the demographics and enrollment behavior of students attending the College. The bulleted list below is intended to provide a summary profile of the students.
The gender divide from 2008 – 2015 has been negligible, with females out- numbering males on average by only 2%.
The largest gender gap was in 2012, with females out numbering males by 7%. In 2015, females and male student populations were virtually equal.
In 2015, the traditional-age college student (18 – 24) comprised 56% of the student population. This number has risen from just 38% of all students in 2010.
Distinct headcounts from 2010 to 2015 show only modest increases from 1,693 to 1,895 students (8% growth) in the less than 19-year-old range, 1,858 to 1,959 students (7% growth) in the 20 – 24-year-old range. Since the total number of students has dropped from 9,165 to 6,686 (a 25% decrease) over the period, this college-age demographic comprised a far larger proportion of total students.
Most of the lost students over the period are from the middle to older age range of 35+, whose population has decreased from 3,685 to 1,546 students, a 58% decrease since 2010. While this group comprised 40% of all students in 2010, it accounted for only 22% of students in 2015. Some of these students were most likely seeking job skills to secure their continued employment or to launch a search for new employment opportunities in the wake of the Great Recession. Others were likely senior citizens as the College had to cut back (-91%) the number of noncredit classes for older adults during this time.
Chart 10: Composition of Student Body by Age Groups, Fall 2010 v. 2015
2010
2015
13%
18%
16%
20%
11%
10%
11%
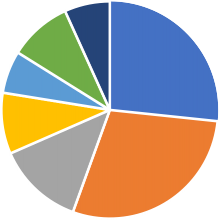
7%
9%
27%
6%
9%
13%
29%
![]()
19 or Less
![]()
20 to 24
![]()
25 to 29
![]()
30 to 34
![]()
35 to 39
![]()
40 to 49
![]()
50 +
Source: California Community Colleges, Chancellor Office, Data Mart; analysis by Cambridge West Partnership, LLC
On average, the most represented ethnicity at the College was the Hispanic student population, comprising 48% of the student body from 2008-2015. The Non-Hispanic White population comprised 32.53% of the student body on average.
Both by raw numbers and by proportion of the student body, the number of Hispanic students has grown, while the numbers of Non-Hispanic White students and students of other ethnic groups have decreased, from 2008 – 2015, as shown below.
Chart 11: Student Body Race/Ethnic Composition, Fall 2008 – 2015
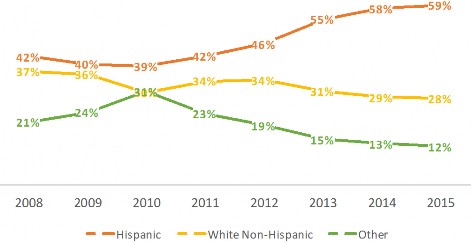
Source: California Community Colleges, Chancellor Office, Data Mart; analysis by Cambridge West Partnership, LLC
The decreasing number of students in the “unknown” race/ethnic group (above included in the “other” category) might explain this trend. From 2010, when the three race/ethnic groups were nearly equal in proportion of students, to 2015, the number of unknown students decreased from 1,806 to 153. If a large portion of these students were actually of Hispanic ethnicity but the data were not reported or captured, then the increase in Hispanic students over the period has been exaggerated.
Chart 12: Racial/Ethnic Distribution of Students 2010 vs. 2015
2010
2015
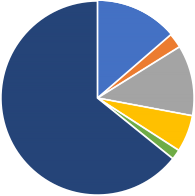
385
69
331
1,806
173
47
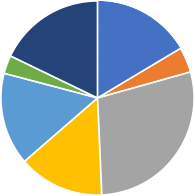
153
141
26
36
132
245
123
![]()
African-American
![]()
![]()
American Indian/Alaskan Native Asian
![]()
Filipino
![]()
![]()
![]()
Multi-Ethnicity Pacific Islander Unknown
Source: California Community Colleges, Chancellor Office, Data Mart; analysis by Cambridge West Partnership, LLC
Regardless of the “unknown” students, the number of White Non-Hispanic students has surely decreased, from at least 3,390 students in 2008 to 1,953 students in 2015, a 43% decrease.
Between fall 2008 and fall 2015 the portion of students attending daytime classes experienced little change, falling from 78% to 77% of students. The portion of students attending evening classes decreased from 18% to 12% over the period. The drop in evening students may be explained by the rise in students whose day/evening status was unknown, from 4% to 11% of all students over the 2008 – 2015 period.
From fall 2008 to 2015, on average more than twice as many students (63% of students) attended classes part-time (less than 12 units) than those enrolled in 12 units or more (26%). Over the period, the number of students studying part- time shrunk by 23%, from 5,549 students in 2008 to 4,482 students in 2015.
On average from fall 2008 to fall 2015, most students (49%) were continuing their studies at the College, while 22% were first-time students, 14% were transfers from another higher education institution, and 3% were special admit students, dual enrolled in high school and the College. Over the period, the transfer group grew the most (20%), while the number of returning students and first-time students both shrank, by 79% and 51%, respectively. The raw number of continuing students remained virtually unchanged, but as a proportion of the total population, rose from 39% to 51% of total students over the period.
The College provides placement assessment experiences for students in the disciplines of reading, writing, and math. For those students participating in the placement experience from fall 2010 to fall 2016 the results draw a portrait regarding the extent to which the students were prepared for a college-level curriculum.
Of the 2,834 reading placement exams from fall 2010 to fall 2016 where students had a course placement recommendation, 26% of the students were placed into a curriculum below the transfer level (ENGL 420) while 74% were referred to ENGL 260, a course one level below transfer.
Of the 4,968 placement exams to test writing skills between fall 2010 and fall 2016, 46% of the students were placed into a curriculum below the transfer level (ENGL 250 or 440). The majority, 54% were placed into ENGL 1A, Freshman Composition.
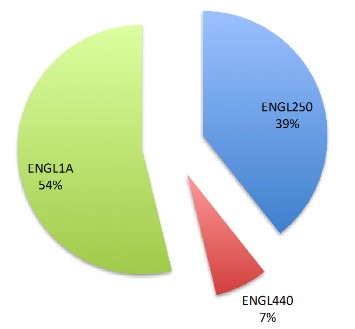
Chart 13: Writing Placement Results
7%
Source: Gavilan College Office of Institutional Research; analysis by Cambridge West Partnership, LLC
Of the 5,017 math placement exams between fall 2010 and fall 2016, 85% of the students were placed into a curriculum below the transfer level (MATH 240, 400, 402, or 430). In the graphic below, MATH 240 is Intermediate Algebra and meets the requirements for the Associate Degree. MATH 5, 7, 1A, and 8A are the transfer courses. Only 13 students placed into MATH 1A, Single Variable Calculus and Analytic Geometry.
Chart 14: Math Placement Results
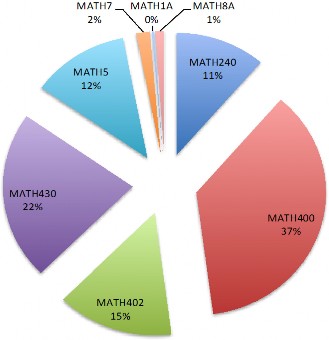
Source: Gavilan College Office of Institutional Research; analysis by Cambridge West Partnership, LLC
Of the students who took more than one placement exam from fall 2010 to fall 2016, 2,750 (55%) of them were recommended to more than one basic skills discipline.
Institution-wide Supports for Learning Library
The mission of the library staff is to provide a safe, respectful and welcoming environment in which the educational community and its work are supported via the delivery of traditional and emerging academic research tools and methods, and where students are encouraged to explore, discover, investigate and develop research skills for personal, professional and life-long learning.
The library staff of two full-time faculty, six part-time faculty, and four full-time classified personnel seeks to promote the following learning outcomes among the students attending the College. Students will be able to:
Use information technology tools to locate, retrieve, organize, and present information.
Increase their ability to state a research question, problem or issue.
Determine information requirements for the research question, problem or issue.
Use the library’s reserve course materials to assist them in their course work.
A key objective of the library instructional program is to support the institutional commitment to the teaching and learning of information literacy across the curriculum. In recent years eight sections of LIB 200 has been paired with ENG 1A courses as part of a learning community. Library faculty members also teach two two-unit courses with information literacy-related curriculum. They are:
LIB3, a basic stand-alone research course, and
LIB140 (cross-listed as AH140), a research course focusing on Allied Health content specifically.
In addition, the library program offers short noncredit online library modules to support credit courses. Additional non-credit courses have supported Allied Health 3, 11 and 180 for several years.
The library has a well-developed and easy-to-use series of web pages with a robust set of tools and resources to assist students through online queries. Students can search College library holdings, use an extensive array of databases to which the College subscribes, locate general research assistance, secure research guides, participate in interactive tutorials, find examples for citing sources, review titles of course reserve materials, and ask questions of the library staff.
Library faculty and staff reflect an orientation toward helping students, faculty, and other members of the Gavilan Community. At the Hollister satellite location librarian assistance is available on Wednesdays 9am-1pm. At the Morgan Hill satellite location librarian assistance is available on Mondays and Tuesdays 9:30am-11: 30 am. Although these two sites have limited library hours, all students can ask for assistance at the Circulation Desk and/or the Reference desk on the main campus. Students can also telephone, email or use an interactive chat function to seek assistance anytime the library is open or the student can leave a message/email query.
Faculty can schedule customized library instruction to support the research a student will do for any speech, written paper, presentation, etc. Topics can include research basics, evaluation of resources, database searching, print information sources, web searching etc.
Community residents do not have to be a student to check out books. A library card or student ID provides access to resources, including books, eBooks, course reserve materials, computers in the library, electronic databases both on campus and from home, and more.
Interlibrary Loan (ILL) service is available if Gavilan College does not own an item that is needed. Self-serve copying and printing services are available in the library.
The library building also houses a series of computer laboratories that are open for students to use when not scheduled for class use (Computer Place, Learning Commons, Student Success Center,) as well as laboratories that support specific instructional or student services activities (Computer Graphics Lab, Digital Media Lab, High Technology Center, Learning Skills Laboratory, Test Proctoring Room, Veterans Resource Center, Writing Center).
The College has established a number of student support offices that provide the services described in the following narrative.
Academic Support Services
Learning Commons
The Learning Commons offers a flexible, technology-rich learning environment for all Gavilan students to study and work on assignments with the support of peer tutors, faculty, and librarians. The Learning Commons partners with instructors and other campus resources to offer students the opportunity to learn and practice essential academic skills in the form of peer-supported learning activities. Students may participate in these activities as part of a class work session, at the recommendation of an instructor, or by attending a workshop or research clinic. Individuals and groups of students are invited to use the Learning Commons to work on any assignment or project for a class.
The Learning Commons provides study rooms, paper and office supplies, a printing station, computers, and friendly staff ready to help students study. Students are welcome to use rolling whiteboards, check out a laptop, work on the Macintosh computers, or test out the touch-screen monitors to work on their next class assignment. The computers provide access to a wide range of office productivity software as well as Photoshop and video editing capabilities.
Civic Engagement
The College has placed a value on civic engagement to encourage students to value others, engage in constructive social change action, and nurture democratic citizenship. The College offers several ways for the students to become involved in this type of learning.
Service Learning
The Gavilan College Service Learning Program provides avenues for students, faculty, and partner organizations to promote justice, diversity, and social responsibility by integrating academic experiences with meaningful service work at a local agency. It allows students, faculty, and community organizations to work together to everyone's benefit. Classes are enriched and made immediate when students apply what they are learning at non-profits in their own communities. The program seeks to foster a culture of lifelong service among the participants, and social service agencies benefit when students come in to do projects, bringing fresh energizing perspectives to the organizations.
Project-based learning and doing action research in the community
The College has a community oral history project in which students can participate by conducting interviews as part of a class assignment then submitting them to the archive.
Computer Labs
Computer Place (LI 115)
This is an open computer lab available to all students on campus. It offers a wide range of software to help students succeed in completing classroom assignments. Technical support is available to help students save and print files, use software programs, or solve other technical problems.
Computer Graphics Lab
This laboratory is a dedicated space for students in the computer graphics and design program. It provides students access to high-powered computers with sophisticated software packages that allow students to complete assignments that apply principles of design and design standards, develop creative problem solving methods, and use appropriate materials to address human factors needs and environmental issues.
Digital Media Lab
This laboratory is a dedicated space for students in the digital media program. It is equipped with powerful Macintosh Pro computers, electronic musical instruments (from Midiman and Avid), professional level camcorder, and advanced printers.
The Macintosh Pro computers have various software packages available for students to complete assignments.
ESL Computer Lab
The ESL Program has its own dedicated computer lab with a variety of software programs for all levels and classes. Students, at their convenience, practice and enhance language learned in class.
Habits of Mind – Habits of Mind are online-based coaching tools to motivate students to succeed in school and in life. Faculty members and staff have used the program to collect information from students about what resources they are aware of and which ones need additional promotion or are missing. It is a vehicle by which the College hears from the students about the extent to which the College is supporting them. It is a faculty inquiry group (FIG) associated with the College Learning Council.
Online at Gavilan
A dedicated web (http://www.gavilan.edu/student/online/index.php) resource page supports students interested in enrolling into an online or hybrid course. The page provides a link to a quick overview of what it is like to take an online course. Library staff members provide an in-person orientation to students about to enroll in the first online class. The LIB 732 resource is an online orientation course that provides a similar orientation to students who are enrolled in a hybrid or an online course at the College.
The orientation to online learning is mandatory for many online classes and therefore is commonly the course with the highest enrollment counts each term.
Math Lab
The Math Lab provides a place for students to practice math skills and receive individualized help with math problems at every level, from Basic Mathematics to Calculus. Students can work with math instructors, the math lab assistant or other students. Computers in the lab provide tutorial software as well as math software for Geometry, Statistics and Calculus projects.
Technology Support
The College provides a web (http://www.gavilan.edu/student/tech/index.php) resource page to assist students with technology assistance issues. Email guidance, help with mobile applications, College portal (MyGav) are some topics covered. Others include general computer help, using the iLearn or course management software for online students, and using student accounts.
Tutoring Center
The mission of the Tutoring Center is to provide students with an opportunity to further develop their learning skills and understanding of course content. Tutoring services are designed in order to increase student success in college. This is accomplished by providing students with an opportunity to work with trained tutors who engage students in the examination of concepts and processes; discussion of ideas and theories; hands on practice; and summarization of findings. It is in this collaborative learning environment that students develop their confidence and independence as a learner. Tutoring services, free to all Gavilan students, are available in the Tutoring Center as well as at the Morgan Hill and Hollister sites. Online tutoring with a live tutor is also provided so that students can submit a question, essay, or paper and receive a reply/feedback from a tutor. The Center staff members have developed a series of study skills handouts that cover a wide range of topics.
Writing Center
The Gavilan College Writing Center fosters, celebrates and encourages writers, the varied and multiple purposes, and the audiences that writing serves. Specially trained student assistants help writers start and strengthen all kinds of class assignments as well as poetry, short stories, song lyrics, business letters and resumes. The Center also offers space for discussions of writing, meetings, workshops and study groups. The Center staff hosts special events with acclaimed writers from the Visiting Writers and Scholars in Residence program. The Center provides self-directed mini-lessons and writing prompts. Students can work at his/her own pace, learn how to get ideas on paper, and practice using correct grammar, spelling and punctuation. Students can also forward completed writing assignments online and receive free writing assistance. The Center collaborates with faculty across the curriculum to increase students’ academic success by providing links to assignments and offering effective research and writing strategies. The Center staff members conduct specially tailored in-class workshops upon request.
Student Support Services
Admissions & Records – The office guides students through the logistical process of registering for courses, fulfilling program requirements, signing up for other College events such as graduation, and obtaining student records.
Assessment: The Assessment office provides Accuplacer test on the main campus, Hollister and Gilroy off-sites, and local area high schools. Scores are provided at the end of the assessment, along with next steps for the registration process.
Associated Students of Gavilan College (ASGC) – The ASGC is an advocacy group for the student population of the College. It practices shared governance and represents the students in Gavilan College Committees, enabling increased dialogue between the student body and the rest of the College community.
Associated Students of Gavilan College Inter Club Council (ICC) – The council functions as the organizational structure through which College students can converge and form officially recognized and funded clubs. Clubs are centered on various academic disciplines and students’ interests. Any student may start a club following the ICC’s guidelines.
Bookstore – The bookstore is operated by the Follett Company, and is presently located in a temporary building in the center of campus. It has an online component that allows students to purchase books, school supplies, technology, and College apparel remotely.
California Work Opportunities and Responsibility to Kids (CalWORKS) – CalWORKS provides counseling, training, textbooks, employment assistance and job placement to parents of families receiving Temporary Assistance to Needy Families (TANF). The program’s goal is to advance educational opportunity and increase the economic agency and self-sufficiency of these disadvantaged students.
Campus Safety – Campus Safety officers, available all day and evening on a daily basis, protect the members and property of the College community.
Career / Transfer Center – The goal of the center is the assist students in taking the next steps from Gavilan College, either onto a career or a 4-year university. Career services include: career assessments, individual career guidance, workshops, and career fairs.
Transfer services include: individual assistance, visits from universities, workshops, transfer fairs, and a resource library.
Cooperative Agencies Resources for Education (CARE) – The program aids single parents in achieving their educational and economic goals. To be eligible for the program, students must first be eligible for the Extended Opportunity Programs and Services (EOPS), and be 18 or over, head of his or her household, receiving cash assistance from the Department of Social Services, and have at least one child under 14. Services include counseling, childcare assistance, books, supplies, and transportation vouchers, and other grants.
Counseling – The counseling department offers academic, career, personal, transfer, and vocational counseling to help all of the College’s students reach their academic and professional goals. Students can walk in without appointment, schedule and meet with counselors in a one-on-one setting, and may also participate in online counseling.
Disability Resource Center – Center staff provide a variety of services to equalize educational opportunities for students with temporary or permanent disabilities. Services include academic and vocational counseling, alternate media services, assistive computer technology and training, job training and placement, learning skills evaluation, liaison with State Department of Rehabilitation, mobility assistance, note-taking, referral services, registration assistance, real-time captioning, sign language interpreting, specialized instruction, support classes, test taking facilitation, and vocational preparation. The Center provides accessibility software programs in all college computer laboratories for those students who have a disability.
Extended Opportunity Programs and Services (EOPS) – EOPS is a state-funded support program for students with social, economic, and/or educational challenges. The program provides qualifying students with academic, career, and vocational counseling, specialized tutoring, vocational preparation and job placement, transfer assistance, student success workshops, book vouchers, early registration, a textbook lending library, and an EOPS club.
Financial Aid and Scholarships: Provides financial aid resources to Gavilan students, to eliminate financial barriers of postsecondary education. Programs administered are state, federal, and scholarship programs. The VA certifying official is housed in the Financial Aid Office, and serves as point person for VA certifications for student veterans.
Fresh Success – The program provides book vouchers, transportation assistance, emergency and legal assistance, counseling, job readiness assistance and support
workshops to students who qualify to receive food stamps under the CalFresh/SNAP programs.
Gavilan Food Pantry – This grocery featuring non-perishable food items at no charge is open to all students who need food assistance. It is located in the library building.
Health Services – The College Heath Services office offers information and referrals, first aid, blood pressure screening, TB testing, flu shots, contraception, smoking cessation, vision testing, and over-the-counter medication to all students enrolled at the College. It also hosts health education presentations and campus-wide events.
Mathematics, Engineering, Science Achievement (MESA) – The program targets disadvantaged and underrepresented students who are potentially interested in math, engineering, and/or science. It provides academic support to help these students reach their academic goals in these subjects while at Gavilan, and to further pursue them upon transfer to a university. The program aspires to create a culture and community of STEM advocates at the college.
Outreach and Recruitment – The program provides campus tours, organizes visits to local area high schools, conducts presentations, and offers other information to prospective students and their parents.
Puente Project – This program combines English instruction, counseling, and professional mentoring to assist qualifying students in advancing their academic and professional career. Participants work closely with their mentors to eventually transfer to a 4-year university. Eligible students must qualify for English 250 and must plan to transfer to a university.
StudentLingo- This is an online resource that provides a variety of success workshop topics in video format that students may access on-demand at this URL https://www.studentlingo.com/gavilan
TRiO Student Support Services – TRiO is a federally-funded program whose goal is to enable first-generation, low income, and/or disabled students to obtain a 2-year degree and transfer to a 4-year university. The program is open to only 160 students who fit the above description. TRiO provides many services, such as: specialized academic counseling and guidance, prioritized registration, equipment lending, university visits, cultural and social activities, Informational workshops, TRiO financial grants, and career and personal development.
Veterans Resource Center – The center provides services to US Military veterans, such as financial aid and scholarship information, VA benefits help, veteran mentors and academic tutoring, readjustment counseling, peer support, mental health counseling, and Veterans Club Activities.
Welcome Center– The Welcome Center is a space for new students to complete registration smoothly, with help from student mentors. It also houses the Financial Aid center, whose goal is to help students find ways to pay for their college tuition and fees.
In addition to these offices the College has aggressively sought to provide online services, forms, and information to students and the community. An extensive list of the online materials is found at Appendix D of this document.
Distinctive Transition Programs
Dr. TJ Owens Gilroy Early College Academy (GECA)
The GECA is an educational partnership between Gilroy Unified School District and Gavilan College, and is one of the cutting-edge Early College High Schools that are being envisioned and funded all across the United States through the Bill and Melinda Gates Foundation. It is an innovative, highly supportive and academically challenging
program designed to serve strongly motivated high school students with high potential for future academic and career success. Students who qualify attend four years of high school on the Gavilan College campus and may receive both their high school diploma and an Associate of Arts Degree or 60 transferrable units at the end of 4 years. Students may take up to 11 units per semester of college classes for which they receive both college and high school credit. Tuition and books are free.
GECA was recognized in 2013 with the State of California's highest honor, California Distinguished School, and, in 2015, GECA received from the California Department of Education a Gold Ribbon Award, and was named one of U. S. News' top ten high schools in California.
High Step Program- High School Enrichment Opportunity
Gavilan College, in conjunction with area high school districts, offers transfer-level courses each fall and spring semester at the area high schools. In recent semesters this has included course offerings at Gilroy, Christopher, Live Oak, Ann Sobrato, Anzar, and San Benito high schools. All courses offered in the High Step program are transfer-level courses accepted at most universities or colleges. The High Step program is designed for high school juniors and seniors. All concurrent enrollment documents (high school contract forms and qualifications) are required. While courses offered through this program are open to all college-aged students, High Step benefits are only included for those who apply through their area high school. Students must purchase their own textbooks and materials; however, assistance from the high school may be available to students who cannot afford the textbooks and/or materials.
Teaching and Learning Center
The College has a long-established program to assist faculty in their core responsibility to teach. Formerly known as the Staff Resource Center, the Teaching and Learning Center is an office, workplace, and location for professional development. Faculty can grade assignments, use a phone, work on a computer, collaborate with colleagues or use the quiet space for a lunch. The Center, located in the mezzanine of the Library, has printers, computers, conference tables, projector, videoconference equipment, and video editing
equipment. Faculty members may check out library resources on teaching modalities, curriculum, designing rubrics, and much more.
Technology professional development offered by the Center includes the following:
Transitioning to teaching in an online environment (hybrid, supplemental or fully online)
Creating an instructor/course web presence
New this fall 2016: Gavilan Online Teacher Training (GOTT) Academy
What You Need Now (WYNN) Regulation Updates for Online Pioneers
Developing multimedia for your course
Software professional development available at the Center includes
MS Office
Photoshop/image editing software
Web editing software
Moodle and Canvas
Lecture capture (multimedia)
Audio/video editing
CCC Confer and other webinar conferencing technologies
The College also sponsors a mentoring program that emphasizes teaching and learning, connected relationships in the academic and general community, and work-life balance.
The College subscribes to on-demand professional development video materials through the Go2Knowledge web site https://www.go2knowledge.org/gavilan. A variety of presentations regarding at-risk students, campus safety issues, organizational development, technology, teaching and learning, and student success are available.
Non-Instructional College Resources to Support the Educational Mission Human Resources
The Human Resources Office supports the instructional program of the College in several ways. It provides new employee orientation sessions, including for student workers, and conducts mandated education sessions in sensitive important topics such as sexual harassment. It promotes participation in regional professional development on a variety of topics about best practices in employee relations. The College has some challenges in recruiting and retaining staff due to its location and pay scales. The Human Resources Office will complete a compensation and classification study in 2016-17 that will develop recommendations for pay increases for adjunct faculty, classified staff, and some management positions. Long-term stability and satisfaction among the College employees will be healthier for the College and helpful to the students.
The Human Resources Office also serves as an important tie between instructors and students for dialogue concerning harassment, violence, and discrimination. The Office is a venue where students can be assured that the College is a safe learning environment.
The Director, the Equal Opportunity Office, maintains an open door for students to file civil rights (Title VI), gender equity, sex discrimination/harassment (Title IX), or persons with disabilities discrimination (ADA/Section 504/508) complaints.
Gavilan College has experienced a 3.7% decrease in the workforce headcount between fall 2010 and fall 2015, from 438 to 422 employees. Between fall 2010 and fall 2015 the numbers of both educational administrators and full-time tenured faculty experienced 37% and 11% reductions, respectively. The classified workforce maintained its average size of 132 employees. The adjunct faculty headcount temporary rose from 2010 to 2012, but returned to the 208 staffing level by 2015.
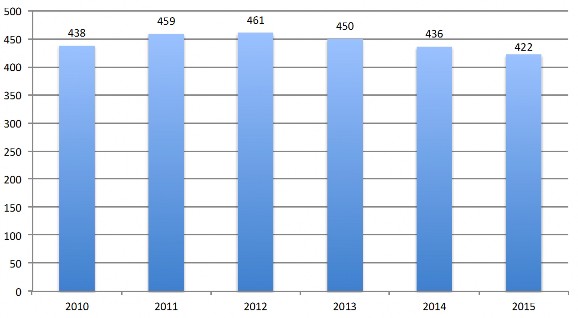
Chart 15: Gavilan College, Employee Headcounts, Fall 2008 to Fall 2015
2010
2011
2012
2013
2014
2015
Source: California Community Colleges Chancellor’s Office. Data Mart; analysis by Cambridge West Partnership, LLC
Since 2010, the total workforce, expressed as units of full-time equivalency (FTE), at Gavilan College has increased by 7% (20 FTEF), with the temporary academic faculty growing tremendously, and the other employee groups decreasing. Over the 2010 to 2015 period, the FTEF level of temporary faculty has increased by 109% (48.5 FTEF), while that of full-time tenured faculty has decreased by 10% (8 FTEF). There was a 40% reduction in educational administrator positions (8 FTEF). Classified employee headcounts decreased by 9% (20 FTEF).
73
Chart 16: Gavilan College, Employee Groups by Full-time Equivalency, 2010-2015
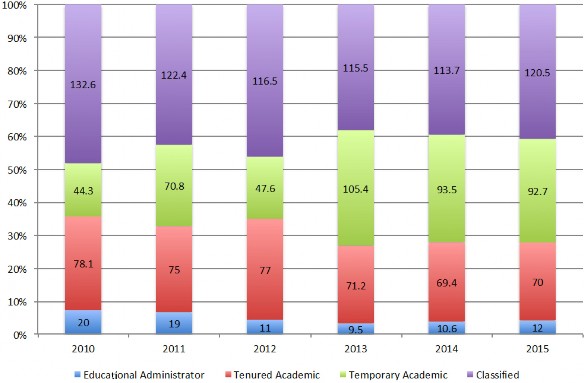
Source: Chancellor’s Office Data Mart, Annual Staff Data Report; analysis by Cambridge West Partnership, LLC
A second analysis of the educational administrator headcounts, grouped by age ranges in fall 2015, reveals that two educational administrators reached the typical retirement age of 60 to 64 years old, and that an additional two were beyond the typical retirement age range of 65 years and older. Moreover, an additional five of the 12 administrators will reach retirement age over the six years following 2015.
Eight of 70 tenured faculty members were working within the typical retirement age range (60-65), and an additional four were working beyond the age range. Although this combined 12 instructors (17%) working at or beyond the retirement age is relatively low, a high of 20 additional tenured faculty members will reach the typical retirement age within six years after 2015.
While temporary academic faculty members are “at will” employees, they represented a large portion of the workforce at a headcount of 207, nearly 50% of the total Gavilan staff in 2015. For this group, 27 (13%) are in the typical retirement age range, and 35 (17%) are working beyond this range. Over the six years following 2015 an additional 22 of the temporary faculty members will reach retirement age.
Given that 30% of temporary academic faculty and 17% of tenured faculty were at or beyond typical retirement age, with an additional 29% of the latter reaching retirement
age within six years after 2015, it may be prudent for the College to start considering strategies for the replacement of teaching personnel.
For classified employees, the normal eligibility age for retirement from CalPERS is 50 years of age with five years of service. So, unlike with administrators and academic faculty, 18 (14%) of classified staff members were at the retirement eligible age, and another seven (5%) were working beyond the typical retirement age. An additional 15 (11%) of classified employees will reach retirement age within the next four years.
Given such large numbers for potential retirement, Gavilan College may need to consider decisions about replacing some of these skilled individuals in order to retain the essential support services they provide.
Table 39: Employee Groups by Age Ranges, Fall 2015
Total
Employee Category Headcount 18 to 34 35 to 39 40 to 44 45 to 49 50 to 54 55 to 59 60 to 64 65 to 69 70 +
Academic, Tenured/Tenure Track | 70 | 6% | 13% | 6% | 16% | 14% | 29% | 11% | 4% | 1% |
Academic, Temporary | 207 | 18% | 10% | 10% | 12% | 10% | 11% | 13% | 7% | 10% |
Classified | 133 | 15% | 15% | 8% | 11% | 14% | 18% | 14% | 3% | 2% |
Educational Administrator | 12 | 0% | 8% | 0% | 17% | 0% | 42% | 17% | 17% | 0% |
Total Employee Headcount 422
Source: Chancellor’s Office. Data Mart; analysis by Cambridge West Partnership, LLC
An inspection of the age group headcounts for the Gavilan College staff as a whole shows that, between 2008 and 2015, the age distribution of the staff was slightly greying, with the number of employees in the older age groups increasing and the number in the younger groups likewise decreasing.
In 2008, the number of college staff at or beyond the typical retirement age range of 60- 64 was 20%, and up through 2015, this figure jumped to 24%, with the 70+ category increasing from 2% to 6% of all personnel. In both years, the “soon to reach retirement age” 55-59 year old group was the largest, with 16% in 2008 and 17% in 2015.
Additionally, the proportion of classified employees at or beyond the typical retirement age of 50-years old increased from 41% to 50% from 2008-2015.
Chart 17: Gavilan College, Staff by Age Group, 2008 v. 2015
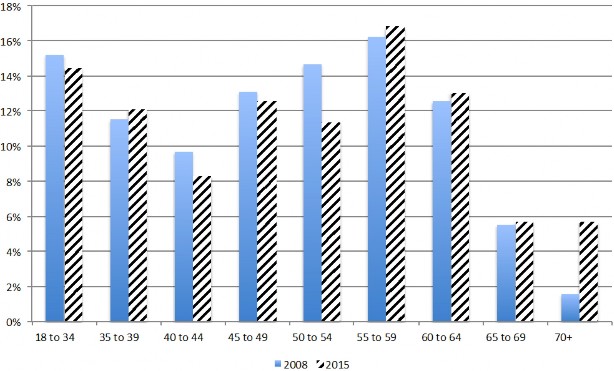
Source: Chancellor’s Office Data Mart; analysis by Cambridge West Partnership, LLC

Gavilan College Duck Pond
Budget
Funding stability is the primary external driver for the college budget as the Business Services Office endeavors to help the College grow and add more services for students. The Business Services Office advances student success through the procurement of goods and services as well as the processing of payments and paychecks for employees and student workers. All instructional and operational areas of the College are able to contribute to student success because Business Services staff members provide the ways and means for them to do so.
From 2006-07 to 2015-16 the annual funded FTES generated by the College has decreased by 0.24%. Throughout this time, the College generated more actual FTES and therefore had unfunded FTES in most years with the greatest amount occurring in 2009-
10. In 2015-16 funded credit instruction averaged 4,649 FTES; noncredit curriculum offerings averaged 536 FTES while career development/college preparation noncredit offerings have averaged 49 FTES.
Chart18: Gavilan College Annual Funded FTES
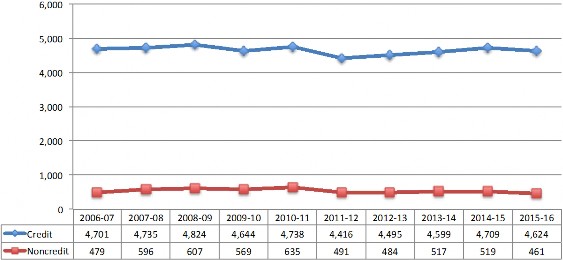
Source: California Community College Chancellor’s Office, Fiscal Services Unit. Reports of Recalculated Apportionment; analysis by Cambridge West Partnership, LLC
At the conclusion of 2015-16 the College had not reached its target base FTES, 5,253.38. Therefore, the College has entered into the State stabilization and restoration program.
The College will receive for 2016-17 the same amount of state revenue that it had been allocated for 2015-16, but no more. If the College cannot recover its base level of FTES within three years, it will be locked into a permanently lower income stream from apportionment.
Table 40: Recent FTES Experience
Full-time Equivalent Students (FTES) | ||||||
Year | Base | Growth | Stability | Restored | Budgeted | Actual |
2015-16 | 5,253.38 | |||||
Period 1 | 5,253.38 | 186.71 | 5,440.09 | |||
Period 2 | 5,253.38 | (74.24) | 5,179.14 | |||
2016-17 | ||||||
Advance | 5,179.14 | 28.43 | 48.25 | 5,255.82 | ||
Source: Fred Harris, Vice President for Administrative Services. Gavilan College Budget Workshop 2016-
17. Slide presentation created August 29, 2016
Gavilan College Bridge
The College has offered a very small portion of its FTES through distance education classes. On average, from 2006 to 2015, only 5% of the FTES was generated through online, Internet-based instruction.
The College was able to retain a 10.5% average ending balance over the last five years as illustrated in the following chart. The ending balance started to decline in 2011-12 as revenue support from the state declined.
Chart 19: Ending Balance Amounts As a Percentage of Total Expenditures
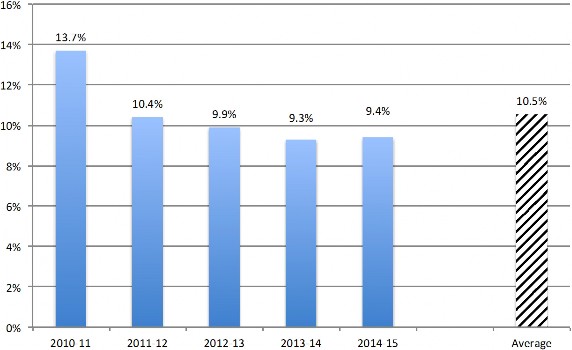
Source: California Community Colleges Chancellor’s Office, Institutional Effectiveness web pages httpts://misweb.cccco.edu/ie/DistrictRates.aspx, retrieved on November 19, 2016; analysis by Cambridge West Partnership, LLC
The College was able to maintain an 81.9% average of expenditures on salaries and benefits over five years as illustrated in the following chart. The 2013-14 and 2014-15 years were exceptional experiences due to full-time employee workforce reduction.
Chart 20: Salaries and Benefits As a Percentage of Unrestricted General Fund Expenditures
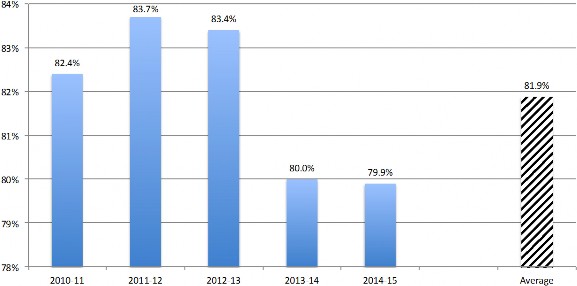
Source: California Community Colleges Chancellor’s Office, Institutional Effectiveness web pages httpts://misweb.cccco.edu/ie/DistrictRates.aspx, retrieved on November 19, 2016; analysis by Cambridge West Partnership, LLC
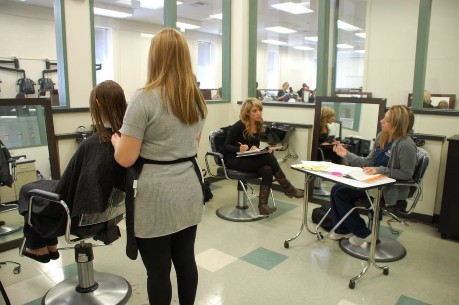
Cosmetology Students
The annual operating excess or deficiency reflects the net increase or decrease in general fund balances. The College was not able to maintain a positive (excess) average over the five years illustrated in the following chart. As illustrated, the 2011-12 academic year had the largest deficiency. It was a particularly difficult and economically stressful year because State revenues had been sharply curtailed. The 2016-17 budget anticipates a deficit of almost $600,000.
Chart 21: Annual Operating Excess or Deficiency
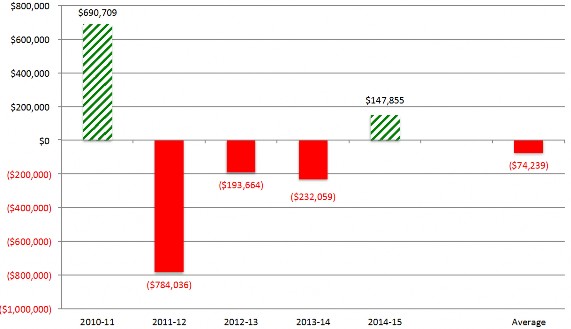
Source: California Community Colleges Chancellor’s Office, Institutional Effectiveness web pages httpts://misweb.cccco.edu/ie/DistrictRates.aspx, retrieved on November 19, 2016; analysis by Cambridge West Partnership, LLC
The cash balance reflects the unrestricted and restricted general fund cash balance, excluding investments. One fiscal year, 2011-12, was exceptional. The College was able to maintain a positive (excess) average of $2,241,506 over the five years illustrated in the following chart.
Chart 22: Cash Balance of Unrestricted and Restricted General Funds
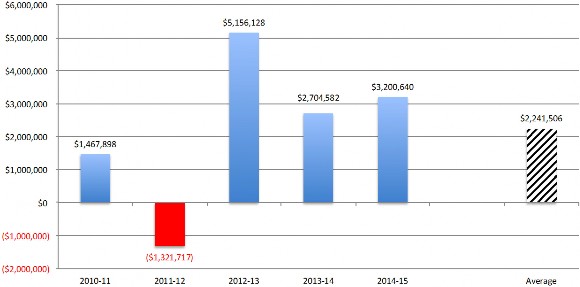
Source: California Community Colleges Chancellor’s Office, Institutional Effectiveness web pages httpts://misweb.cccco.edu/ie/DistrictRates.aspx, retrieved on November 19, 2016; analysis by Cambridge West Partnership, LLC
The Board of Trustees must address these fiscal facts in the coming years. Some income originally from Proposition 30 will continue due to the passage of Proposition 55 that extends the income tax on high-income earners. Starting in January 2018 the Affordable Care Act provides financial penalties for “Cadillac” medical benefit plans. Those penalties might one day impact the College. The State’s allocations to the districts for FY2015-2016 and FY2016-2017 were unusually generous and were based upon unexpected State revenue growth. The magnitude of growth in State revenue may not be repeated in future years and the unusual level of funding through “one time” money and categorical program dollars may not be repeated. Starting in July 2014 the District’s contribution to CalSTRS for each covered employee started to increase from 8.25% to 12.58% for 2016-17. The contribution percentage is scheduled to increase to 19.1% by 2020 and remain at that level until 2046-47.26 The CalPERS retirement contributions for classified employees will increase from 12.46% in 2014 to 20.4% by 2020-21.27
The budget development process at Gavilan College historically has been completed as a “rollover” process. The academic department heads and managers of support departments were provided with budget development sheets that displayed their discretionary
![]()
26 Provisions of AB 1469. Retrieved April 30, 2016 from www.calstrs.com/calstrs-2014-funding-plan
27 Michael Youril. Rate Hike Ahead: CalPERS Proposed Strategy Means Contribution Rates Will Continue to Rise for the Foreseeable Future.” Retrieved May 2, 2016 from www.calpublicagencylaboremploymentblog.com
accounts, and they were allowed to move their budget from one category to another to better serve their needs. The College Budget Committee is an advisory group to the President’s Council on financial issues. It discusses and considers recommendations regarding financial issues and promotes the dissemination of financial information to representative constituency groups.
Budget augmentation requests to support activities that will accomplish a program objective and advance the College’s strategic goals are reviewed and prioritized by the deans, directors and College Budget Committee at several points in the budget development cycle. The Committee evaluates the requests on four criteria: (1) extent of orientation to student success goals; (2) cost vs. benefit; (3) extent of linkage to the College strategic plan; and (4) extent of data analysis and support/evidence.
Apart from the operating budget, the college has been in a long-term capital improvement effort since the passage of Measure E in 2004. The following are highlights of completed projects:
Tennis court repairs
Boiler replacement
Infrastructure replacement
Computer replacement
Enterprise Resource System
Interim instructional spaces
Parking lot expansion / resurfacing
Renovations of Mathematics, Physical Science, Life Sciences, Art, Music,
Humanities, Security and Facilities, and Multipurpose buildings.
Land purchase - Coyote Valley
Land purchase - San Benito County
Cosmetology / Business Renovation
Roof repair for gymnasium and science buildings Campus and building signage
Social Science building
Gilroy Campus modernization project
San Martin airport instructional facility for aviation
Habitat mitigation at Coyote Valley and San Benito County
The College’s credit rating has been sound and it is drawing down the last of those bond funds for work in 2016-17. A portion of the final funding is supporting the construction and improvement of 15 acres within the total 55-acre site for the Education Center at Coyote Valley (to be completed by February 2017). Other portions are dedicated to swimming pool renovation, gymnasium, and sports field projects (to be completed in spring 2018). The last part of the project is seismic upgrades to the student center, to be completed by February 2017.
Technology
Management, support, and procurement of technology at Gavilan is the responsibility of the Information Technology (IT) Department that is centralized at the College District’s main campus in Gilroy and also serves satellite campuses in Hollister and Morgan Hill. The Director of IT leads this department, which coordinates technology planning, prioritization and budgeting with others in the College leadership, including Deans, Vice Presidents, and various managers.
The broad mission of the IT Department is to provide Gavilan students, faculty, and staff with technological equipment and services that enable learning and growth within a diverse community. Services include device and software support, web development, programming, training, and seeking out and procuring up-to-date technology for the campus. The IT department also gathers and reports campus-wide data for the Community College Chancellor’s Office.
Over the past decade and more so into the future, the growing ubiquity of technology in education requires that more thought, resources, and funding be directed toward the Gavilan IT department to keep it from falling behind the technology of its competitor colleges. Important technology that the department has supported and continues to support include, in order of priority:
Moving towards virtual infrastructure in order to reduce costs and save space. This includes a virtualization of all backend servers, and a college-wide implementation of a Virtual Desktop Infrastructure (VDI), which will allow students to access College resources and services from their own devices.
Advancing distance education through the growth of online learning environments such as iLearn, which enables students to browse courses and receive instruction remotely online, and NetTutor, which provides tutoring services for distance education students.
Betterment of services without increased costs—for instance, moving towards paperless forms of campus administrative management, a desired technological improvement by a portion of Gavilan staff. A transition to full paperless processing will require a complete institutional buy in.
Continuing to utilize various technological methods to increase student success by streamlining assessment, educational planning, and counseling. These methods include Accuplacer, Degreeworks, SARS, and the Gavilan Early Alert Referral System (GEARS).
Continuing to upgrade the technological capability of all classrooms to “smart classrooms,” which can utilize web and AV technology to deliver dynamic instruction.
Improving communication with the whole student body through either text or email capability.
The 2014-2019 Technology Master Plan presents the following directives that guide Gavilan’s technological development. In developing its technology, Gavilan must:
Manage constrained resources
Provide ubiquitous access to education
Keep current on today’s technology to prepare students for today’s and tomorrow’s workforce.
Properly integrate technology into the learning environment and train faculty accordingly.
Support administrative services
The Technology Master Plan establishes many specific items to be pursued over the five- year period. Some of the prominent pursuits that span across Student Services, Instructional Services, Administrative Services, and Institutional Services are to:
Increase awareness and accessibility of resources, programs, and classrooms for students with disabilities.
Provide an ID system, email, and integrated platform to access Gavilan services for all students.
Refine the data gathering and sorting system, in particular by developing a way to identify and contact drop-out students.
Upgrade Morgan Hill and Hollister campuses to smart classrooms.
Provide training for faculty who will participate in distance learning instruction.
Implement document processing for administrative offices to allow for electronic signatures.
Establish minimum standards of technological competence for faculty and staff, also to be required in the hiring process.
Implement a Content Management System (CMS) for Gavilan website.
Prepare a disaster recovery strategy, including backup capability and recovery hardware and software.
Implement various improvements in the monitoring, evaluation and maintenance of all network and server hardware and infrastructure.
Evaluate existing equipment, facilities, programs in light of their quality and adherence to state standards.
Improve equipment and infrastructure for various department offices, classrooms, and other facilities.
Space and Facilities
The Facilities Services Office faces significant challenges in its work to construct, repair, and maintain facilities at the 50-year old main campus, as well as at the extension center sites. In addition to the age of some buildings, the potential increase in student population, and the demand for more technology offer additional challenges in providing a safe, clean, and healthy environment for all students, staff, and visitors to the campus locations.
The College buildings inventory includes two structures, the Chapel and Mayock House, constructed in the 19th century and moved to the property for historic preservation reasons. Fourteen of the primary instructional buildings were constructed in the decade of the 1960’s. A subsequent wave of construction witnessed 11 buildings, mostly to support the physical education program during the decade of the 1990s. Eleven additional buildings such as the Morgan Hill center and the San Martin Aviation complex were erected from 2000 to 2016.
The Chancellor’s Office monitors the use of five types of interior spaces at all community colleges. Any functionally usable interior space that could be assigned to an occupant is described as assignable square footage (ASF). Most interior space is considered assignable, but restrooms, mechanical equipment rooms, janitor’s closets, and corridors are not considered assignable. The annual Space Inventory Report is the means by which the College communicates to the Chancellor’s Office space utilization changes. Below is a summary of the most recent Space Inventory data.
Table 41: Gavilan College, 2016 Space Inventory Data
Category | ASF |
Classroom | 25,545 |
Laboratory | 54,976 |
Office | 28,698 |
Library | 19,294 |
AV, TV, Radio | 5,336 |
Physical Education | 34,513 |
Assembly | 9,861 |
Inactive | 957 |
All Other | 39,211 |
Total | 218,391 |
Source: California Community Colleges, Chancellor’s Office. Gavilan College Space Inventory. FUSION Database. Retrieved from fusion.deltacollege.edu on November 19, 2016.
The College provides most instructional and student support services at the 147-acre main campus. However, there are two future satellite locations to be developed. Just south of Hollister, in San Benito County, an approximately 80-acre plot was purchased for a future educational center. In the Coyote Valley area, at the southern part of Santa Clara County, phase one at a 55-acre site opened in spring 2017 as a regional public safety center with some general-purpose classrooms. The College has historically offered instruction in leased properties, primarily in Morgan Hill and Hollister. Other important off-campus locations include the Gilroy High School, Hope Rehabilitation Services Work Activity Center in Gilroy and Hollister, JTPA Training Center in Hollister, and a newly established aviation maintenance instructional program site at the San Martin Airport.
The College has also operated seven, mostly non-credit sites, in the Hollister area.
State standards for construction and renovation of facilities are basically focused on capacity. Capacity, as discussed in the Facilities Planning Manual, is correlated with the production of Weekly Student Contact Hours (WSCH). WSCH represents the average number of hours of student instruction in a week per class, i.e., 30 students enrolled in a class that meets 3 hours per week is 90 WSCH. This WSCH is then transformed into instructional space or ASF. Each WSCH type, lecture vs. laboratory, generates an “appropriate” instructional facility addressed as assignable square footage (ASF). In evaluating the extent to which the College has made good use of the existing lecture and laboratory facilities a comparison is made between the actual WSCH generated vs. the calculated cumulative capacity of those instructional spaces.
On the other hand the formula for evaluating office space is more complicated and different. Office space evaluation compares the ASF to a calculation of the full-time equivalent number of instructional personnel times a constant space value.
With the key types of space a ratio greater than 100% indicates that the institution has more facility capacity than it is using while a ratio lower than 100% indicates that the institution needs additional facility capacity to accommodate properly the students and staff. From the instructional program perspective, the two most important types of facilities are classroom lecture and laboratory space. From the perspective of student services and general administrative offices, perhaps the most important type of facility is office space.
The current status of the cumulative capacity compared to the load creates a ratio. The 2018-19 Five-Year Construction Plan shows the following extent to which the key space types are currently being used.
Table 42: Gavilan College Capacity to Load Ratios, 2017-18
Analysis for Academic Year 2017-2018
Space Type ASF | Wkly. Student Contact Hrs. Actual/Projected Cumulative Capacity/ WSCH (Load) Capacity Load Ratio | Full-time Equivalent Actual/ Cumulative Capacity/ Projected Capacity Load Ratio | |||||
Lecture | 25,160 | 53,007 | 53,078 | 100% | |||
Laboratory | 48,350 | 22,086 | 19,852 | 90% | |||
Office | 27,886 | 275 | 199 | 72% | |||
Source: California Community Colleges, Chancellor’s Office. Gavilan College 2017-18 Five Year Capital Construction Plan. FUSION Database. Retrieved from fusion.deltacollege.edu on November 19, 2016.
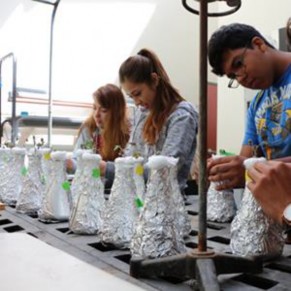
Science Symposium Students
Institutional Mission and Effectiveness Scorecard
The Gavilan College mission is to cultivate learning and personal growth in students of all backgrounds and abilities through innovative practices in both traditional and emerging learning environments, transfer pathways, career and technical education, developmental education, and support services that prepare students for success in a dynamic and multicultural world.
The College has evaluated data about its performance with respect to its mission and goals that it has established and the accountability framework used by the community college system. The State first introduced an accountability system for the community colleges in the late 1990s. At that time the Partnership for Excellence (PFE) established system-wide goals for performance in exchange for enhanced funding. By 2004 legislative action replaced the PEF initiative with the Accountability Reporting for Community Colleges (ARCC), which created college-specific reporting in addition to system-wide reporting. The framework approached the outcomes measures based on cohort analysis of students whose behavior defined their intentions. Although colleges were encouraged to develop their own goals for improvement on the outcome measures there were no financial incentives or penalties attached to performance.
The outgrowth of the Student Success Task Force (SSTF) initiative was 2012 legislation that fine-tuned the ARCC framework into what has been renamed the Scorecard. Like the ARCC framework, the Scorecard outcomes for Student Progress and Achievement (SPAR), persistence, and 30-units completed, places a student into the cohort if the student:
Is a first-time student in the academic year
Has completed six units
Attempts any level math or English
The difference in the two frameworks is that the Scorecard restricts the students to three years, rather than six years, as was the case with ARCC, to complete the behavior that qualifies them to be in the cohort. Those that do meet the criteria are placed into the denominator used to calculate the various rates.
The Scorecard emphasizes milestones or momentum points in a student’s college experience as well as final outcome measures that all colleges are expected to use when planning activities to improve institutional performance. The Scorecard reports student outcomes in these five metrics:
Student Progress and Achievement (SPAR)
Earned a AA, AS or certificate of achievement, or
Transferred to a four-year institution, or
Transfer-prepared (earned 60 transferable units with a 2.0 GPA)
Persistence
Earned six units,
Attempted math or English, and
Enrolled in credit courses three consecutive primary terms anywhere in the California community college system
30 Unit Completion
Earned at least 30 units anywhere in the California community college system
Career and Technical Education (CTE) completion
Completed more than 8 units in a three-year period in the same CTE discipline, and
Earned a AA, AS or certificate of achievement, or
Transferred to a four-year institution, or
Became transfer-prepared
Basic Skills Progress
Attempted a below-college-level English, ESL or math course and successfully completed a college-level course in the same subject area
Students who were qualified to be in the cohort and who also achieve one of the outcomes listed above are counted in the numerator used to calculate the various rates.
Institutional Effectiveness and Program Improvement Goals Framework
District Fiscal Viability Indicators
Fund balance (required)
Salary and benefits (optional)
Annual operating excess deficiency (optional)
Cash balance (optional)
District Programmatic Compliance with State and Federal Guidelines Indicators
Audit findings of financial statement (required)
Audit findings of state compliance (required)
Audit findings of federal award/compliance (required)
College Student Performance and Outcomes
Completion rate- college-prepared students (optional)
Completion rate- unprepared students (optional)
Completion rate- overall (optional)
Remedial rate- math (optional)
Remedial rate- English (optional)
Remedial rate- ESL (optional)
Career technical education rate (optional)
Successful course completion (required)
Completion of degrees (optional)
Completion of certificates (optional)
Transfers to four-year institutions (information item only)
College Accreditation Indicator
Status (required)
College Fiscal Viability Indicators
Full-time equivalent students (optional)
College Choice Indicators
College choice student achievement (one required)
Completion rate- unprepared students
Remedial rate- math
Remedial rate- English
Remedial rate- ESL
Optional College Choice Indicator
College may self-identify an indicator related to any topic
Institutional Set Standards
In response to U.S. Department of Education requirements and ACCJC expectations the College has set a series of minimum student achievement performance standards for the institution as a whole. For 2014-2015 those performance standards are reflected in the table below.
Table 43: Institutional Set Standards
2014-15 | ||
# | Student Achievement Institutional-Set Standard Topic | Standard |
14a | Successful Course Completion Standard | 72% |
14b | Successful Course Completion rate for fall 2015 | 71.0% |
15a | Completion of Degrees and Certificates Combined Each Year Standard | 844 |
15b | Completion of Degrees Per Year Standard | 440 |
15c | Completion of Certificates Per Year Standard | 404 |
16a | # of Students Who Received a Degree or Certificate in 2014-15 | 599 |
16b | # of Students Who Received a Degree in 2014-15 | 443 |
16c | # of Students Who Received a Certificate in 2014-15 | 404 |
17a | # of Students Who Transferred to a 4-Year School Each Year Standard | 0 |
17b | # of Students Who Transferred to a 4-Year School in 2014-15 | 384 |
18a | Does The College Have Certificate Programs That Are Not CTE | Yes |
18b | If yes, Please Identify them | |
Biotechnology, Communications Study, Interpersonal Communications, Kinesiology: Personal Fitness Trainer, CSU General Education, IGETC General Education, Music: Composition/Production, World Philosophies and Religions, Spanish, Spanish Non-Native Speaker 2 and 3, Spanish Native Speaker 4, Social Science: Community Studies, Theater: TV Performance | ||
19a | # of Career-Technical Education Certificates and Degrees | 69 |
19b | # of Career-Technical Education Certificates and Degrees That Meet Employment Standards | 0 |
19c | # of Career-Technical Education Certificates and Degrees For Which The College Has A Standard for Licensure Passage Rates | 0 |
19d | # of Career-Technical Education Certificates and Degrees For Which The College Has A Standard for Graduate Employment | 0 |
Source: Gavilan College, 2016 ACCJC Annual Report
The U.S. Department of Education and ACCJC have communicated their expectations that colleges will also monitor the licensure examination pass rates and job placement rates of program graduates. As of 2016 there were too few students (3 students) completing the Cosmetology state examination to be able to obtain the results.
Independent of the State scorecard or other accountability frameworks, the College strategic priorities and goal setting processes identified several key performance areas where the institution intends to make progress. The entire set of strategies and goals are found in Appendix SP. The strategies that are most closely related to the Educational Master Plan include:
Strategy #1: Optimize enrollment, course offerings, and services to reflect community needs and growth28
Strategy #2: Improve student services and enhance curriculum and programs in order to help students meet their educational, career, and personal goals.
Strategy #3: Improve and expand existing facilities to enhance the learning environment.
Strategy #5: Implement the Educational Master Plan goal specifying development of multi-college expansion by coordinating all instructional programs, student and administrative support services, organizational structure and staff, and site development through linkage with Strategy 3.
Strategy #7: Develop and implement a plan for creating a College Life program, including outreach, recruitment, and support of increased numbers of international students.

Graduation Day
![]()
28 Gavilan Joint Community College District. Strategic Plan FY 2015-16 Through 2019-2020. August 11, 2015
Each pair of columns in the graphic below represents students who enrolled in a community college during the identified academic year. To be included in the cohort these students, within the first three years of enrollment, complete six units of credit and attempt any level of math or English. The students were followed for a period of six years. They are included in the numerator of the completion rate calculation if they achieved one of four outcomes for the SPAR metric: (1) transfer to a four-year institution; (2) earn an Associate Degree; (3) earn a Certificate of Achievement; or (4) become transfer-prepared in terms of GPA by completing 60 transferable units.
Because student cohorts are being followed for a period of six academic years, the most recent data is the cohort that entered college in 2009-10.
Chart 23: Comparative Scorecard Rates
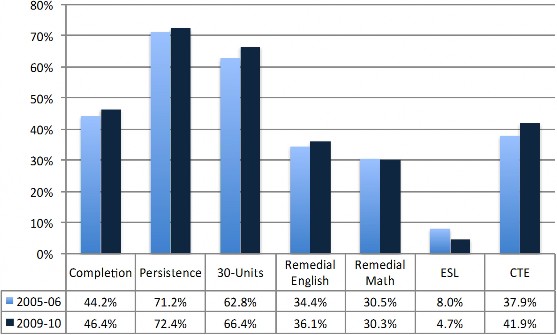
Source: California Community College Chancellor’s Office, 2016 Scorecard Report; analysis by Cambridge West Partnership, LLC
Additional details and trend lines are found in the Office of Institutional Research web page- gavilan.edu/research.
The number of program awards, degrees and certificates of achievement, can be identified on an annual basis. These are important final outcome indicators monitored by the College. The numbers of awards has increased from 2011-12 to 2015-16 by 74%. The greatest category of increase has been the Certificates (206%).
Chart 24: Degrees and Certificates of Achievement Awarded
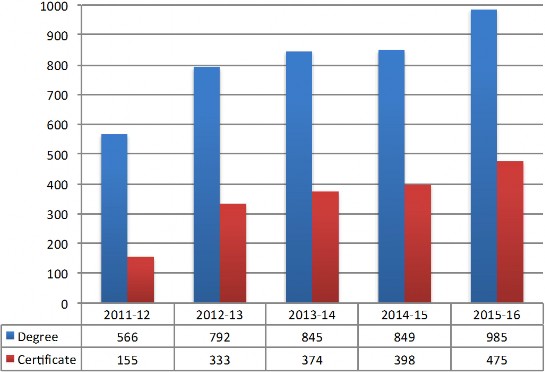
Source: Gavilan College. Office of Institutional Research
Additional details about awards are available at the Office of Institutional Research web page under reports and other publications- gavilan.edu/research.
The broad discipline area in which the college has made these awards is illustrated in the table below. In the past, a broadly defined program of study, Interdisciplinary Studies, was the degree of choice for students who wanted a general preparation for transfer. As more discipline-specific Associate Degrees for Transfer are implemented, consistent with the SB1440 legal framework for transfer to the CSU system, the awards in discipline- specific curriculum areas are likely to increase. Additional details on awards granted can be found at the College Office of Institutional Research web page, gavilan.edu/research, and the interactive Fact Book, GAVData.
Table 44: Details of the Most Often Awarded Degrees and Certificates
Annual Awards of Degrees and Certificates 2011-12 to 2015-16
Program Type TOP2 2011-2012 2012-2013 2013-2014 2014-2015 2015-2016 Total Overall %
Interdisciplinary Studies | 49 | 146 | 315 | 342 | 353 | 449 | 1,605 | 40.5% |
Health | 12 | 119 | 137 | 146 | 146 | 151 | 699 | 17.6% |
Business and Management | 05 | 60 | 69 | 77 | 60 | 84 | 350 | 8.8% |
Public and Protective Services | 21 | 51 | 56 | 45 | 60 | 57 | 269 | 6.8% |
Humanities (Letters) | 15 | 50 | 45 | 41 | 54 | 61 | 251 | 6.3% |
Engineering and Industrial Technologies | 09 | 19 | 29 | 44 | 44 | 45 | 181 | 4.6% |
Commercial Services | 30 | 40 | 28 | 26 | 28 | 30 | 152 | 3.8% |
Family and Consumer Sciences | 13 | 28 | 30 | 18 | 28 | 12 | 116 | 2.9% |
Information Technology | 07 | 20 | 20 | 17 | 15 | 19 | 91 | 2.3% |
Fine and Applied Arts | 10 | 10 | 11 | 16 | 12 | 10 | 59 | 1.5% |
Foreign Language | 11 | 4 | 11 | 8 | 15 | 13 | 51 | 1.3% |
Social Sciences | 22 | 7 | 5 | 7 | 5 | 16 | 40 | 1.0% |
Media and Communications | 06 | 11 | 5 | 9 | 8 | 4 | 37 | 0.9% |
Biological Sciences | 04 | 1 | 5 | 5 | 8 | 3 | 22 | 0.6% |
Psychology | 20 | 16 | 16 | 0.4% | ||||
Mathematics | 17 | 1 | 3 | 5 | 4 | 1 | 14 | 0.4% |
Education | 08 | 6 | 5 | 1 | 12 | 0.3% |
Total 573 769 806 845 972 3,965
Source: California Community College Chancellor’s Office, Data Mart; analysis by Cambridge West Partnership, LLC

Gavilan College Main Walkway, Quiet Afternoon
Students who actually transfer to one of the two public university systems in California are counted in the SPAR outcome measure. Between 2011-12 and 2015-16 there has been a 13% decrease in the numbers of students who transferred to a University of California (UC) campus and a 6% increase in the numbers of students who completed a transfer to a California State University (CSU) campus. During those years the college has annually averaged 24 students to UC and 219 students to CSU. Fiscal constraints prompted both public university systems to curtail transfer student acceptances, which in turn adversely impacted the numbers shown in the graphic below. Additional details are found in the College Office of Institutional Research web page, gavilan.edu/research, and interactive Fact Book, GAVData.
Chart 25: Annual, Full-year Transfers to CSU and UC
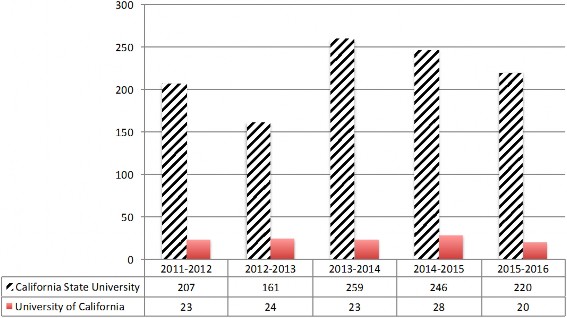
Source: UC Student Source Files, CSU Student Source Reports; analysis by Cambridge West Partnership, LLC
As an alternative to the public university systems, some transfer-oriented students from the College have entered either an in-state private or an out-of-state institution. From 2010-11 to 2014-15 (last year of available data) there has been a 10% increase in the numbers of students attending in-state private institutions and a 19% increase in the student count of those attending an out-of-state institution. The analysis below considers the transfer event from the perspective of a transition year in which the Gavilan College student affects the transfer to a four-year institution by enrolling at the senior institution. The analysis does not consider the length of time it took the student to complete the preparation to transfer or to make the actual transfer. Far and away the most popular in- state private schools have been Argosy University- the Art Institute of California and National Hispanic University. The University of Phoenix is far and away the most popular out-of-state institution.
Chart 26: Full-year Transfers to Out-of-State (OOS) and In-State Private (ISP) Schools
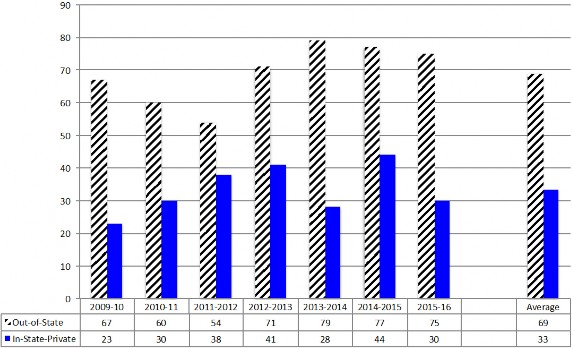
Source: California Community College Chancellor’s Office, Data Mart; analysis by Cambridge West Partnership, LLC
A transfer cohort methodology has been developed by the Chancellor’s Office. The method tracks groups of first-time students for six years to determine if they show a “behavioral intent to transfer.” In this methodology students are assigned a cohort year based on the year they first enroll in a California community college and they are attributed to the community college where they earned the most units of credit.
The initial cohort of students is tracked for six years after the initial enrollment to determine if they have completed twelve units of credit and attempted transfer-level math or English. If they have, the student is placed into the cohort and their transfer outcome is considered over a variety of time frames up to sixteen years. The outcome of transfer is monitored through a data match with the National Student Clearinghouse (NSC), UC and CSU.
Past research by the Chancellor’s Office has concluded that most students complete the transfer process by the sixth year after initial enrollment. An extended analysis of Gavilan College transfer data suggests that indeed after the sixth year, the trend of steady increases in the numbers of students who transfer does drop off. However, some students from those initial cohorts do continue to transfer and they drive the transfer rate higher than is generally acknowledged. As illustrated below, when students are followed for an extended period of time 50% of the cohort does transfer.
Chart 27: Extended Transfer Rates, 1995-96 to 2008-09, Selected Cohorts
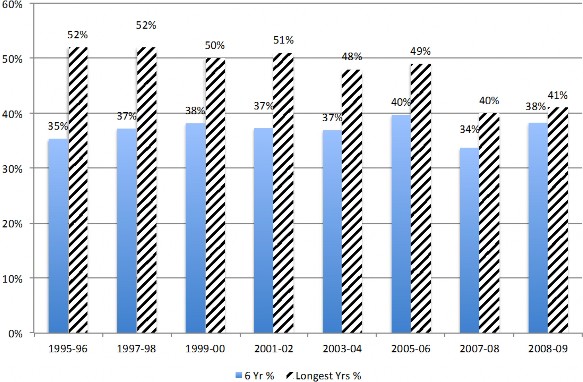
Source: California Community College Chancellor’s Office, Data Mart; analysis by Cambridge West Partnership, LLC
For students who intend to transfer, completing 30 units is an important and momentous milestone because it indicates that they are halfway to the transfer point. For career and technical education students who neither transfer to a four-year institution nor receive an award from the College, the completion of 30 units translates to substantial gains in wages upon leaving college. Two years after leaving the community college these students have been shown to earn about as much as the vocational student who completes an occupational degree or certificate. For these reasons the accumulation of 30 units of credit was included in the Scorecard as a milestone progress marker.
In the cohorts of students entering the College in 2005-06 and 2009-10 there are documented differences among five of the seven ethnic subpopulations of students who achieved the outcome of completing 30 units of credit. However, insufficient numbers of students do not allow meaningful comparisons for American Indian/Alaskan Native and Pacific Islander students.
In this analysis the years represent the academic year in which the student entered a community college for the first time. To qualify into the cohort a student must, within three years, complete six units and attempt any level of math or English. Those qualified students are tracked for six years. The numerator in the rate calculation is the number of those qualified students who accumulated 30 units of credit within six years of entering a
Chart 28: Percent of Students Who Earned at Least 30 Units, Overall Rates
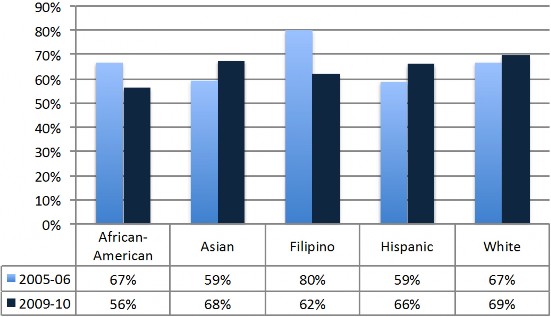
Source: California Community College Chancellor’s Office, 2016 Scorecard Report; analysis by Cambridge West Partnership, LLC
Completing 30 units is an outcome from persistent re-enrollment. The Scorecard and the College are interested in promoting student persistence for at least three consecutive terms. In the graphic below there are persistence differences among five of the seven ethnic groups of students. But insufficient numbers of students preclude meaningful comparisons for American Indian/Alaska Native and Pacific Islander students.
Again, in this analysis the years represent the academic year in which the student entered a community college for the first time. To qualify into the cohort a student must, within three years, complete six units and attempt any level of math or English. The numerator in the rate calculation is the number of those qualified students who in fact persisted in enrollments during three consecutive terms.
Chart 29: Persistence Over Three Consecutive Terms
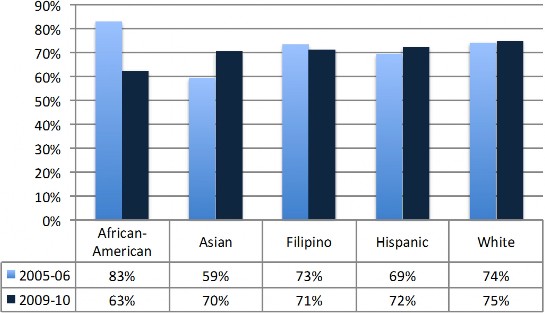
Source: California Community College Chancellor’s Office, 2016 Scorecard Report; analysis by Cambridge West Partnership, LLC
A common measure of organizational performance that stimulates persistence and the accumulation of credit units is the success rate of students enrolled in the different categories of credit curriculum. The rate is calculated by comparing the number of students who earned a grade of C or better to the number of all students who were still enrolled in the course after the normal add and drop period ended.
Over the last seven fall semesters student success rates have improved in the basic skills category of curriculum offered in a face-to-face modality. From 2010 to 2016 the absolute change in the basic skills curriculum success rate was 6.2%. The average success rate for each category of curriculum is shown in the final set of columns on the right. The graphic below represents enrollments in the fall terms identified and is not a cohort study. Additional details and trend lines are found in the Office of Institutional Research web page, gavilan.edu/research, and in the interactive Fact Book, GAVData.
Chart 30: Fall Term Student Success Rates by Type of Course, Face-to-Face Instruction
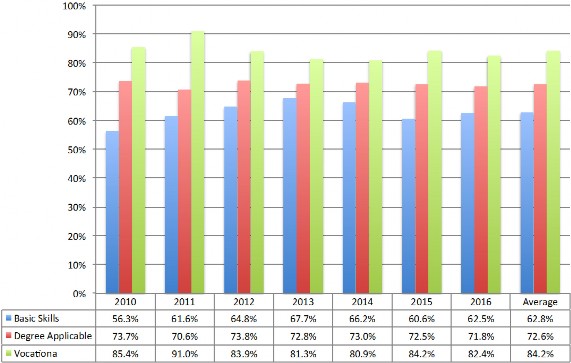
Source: California Community College Chancellor’s Office, Data Mart; analysis by Cambridge West Partnership, LLC
A similar fall term analysis was completed for courses offered through distance education. From 2010 to 2016 the greatest absolute change in the success rate was in the vocational curriculum where the rate increased 12%. The average success rate for each category of curriculum is shown in the final set of columns on the right. The graphic below represents enrollments in the fall terms identified and is not a cohort study.
Additional details and trend lines are found in the Office of Institutional Research web page, gavilan.edu/research, and in the interactive Fact Book, GAVData.
Chart 31: Fall Term Student Success Rates by Type of Course, Distance Education
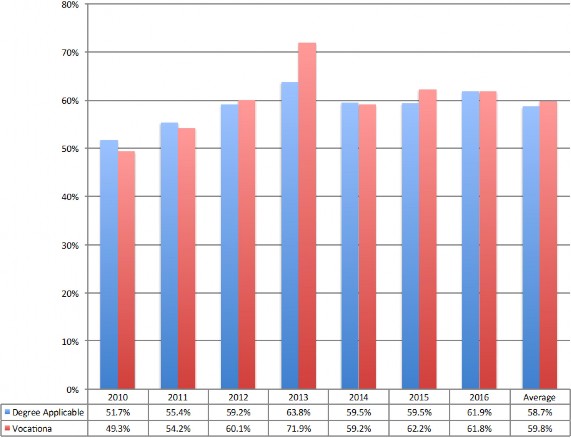
Source: California Community College Chancellor’s Office, Data Mart; analysis by Cambridge West Partnership, LLC
Additional analysis of course success and retention, on an annual basis, can be found in the interactive College Fact Book, GAVData, located at the Office of Institutional Research web page- gavilan.edu/research.
The basic skills curriculum is of particular interest to the College and the Scorecard because so many students begin their college experience in that curriculum. In the Scorecard analysis the years represent the academic year in which the student entered a community college for the first time. To qualify into the cohort a student must, within six years, attempt a math, English or ESL course below transfer level (2-4 levels below for math). The numerator in the rate calculation is the number of those qualified students who, within six years, complete a higher-level course in the same discipline. For English composition it includes completion of a college-level English course. For math the students must complete a college-level math course or a math course that is one level below transfer. The ESL students must complete the ESL sequence or a college-level ESL course.
The experience of basic skills students in English composition, math, and ESL is captured in the graphic below. Both of the cohorts have improved their success rate in English and math. Because student cohorts are being followed for a period of six academic years, the most recent data is the cohort that entered college in 2009-10.
Additional details and trend lines are found in the Office of Institutional Research web page-gavilan.edu/research.
Chart 32: Basic Skills Student Migration Success
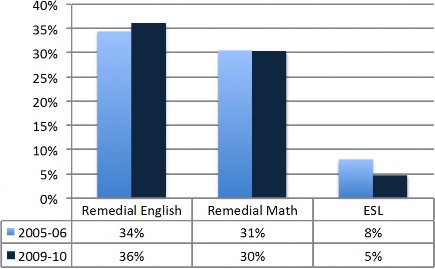
Source: California Community College Chancellor’s Office, 2016 Scorecard Report; analysis by Cambridge West Partnership, LLC
Campus research into the flow and success of basic skills students through the English composition curriculum sequence determined that on average 14% of the students starting below transfer level eventually completed the English 1A composition course.29 The College has experimented with an accelerated curriculum design in English by
![]()
29 Gavilan College, Office of Institutional Research. Basic Skills English Cohort Tracking Two Levels Below. August 10, 2016.
combining reading and writing instruction together. The College also experimented with using multiple measures beyond an exam score to inform composition course placement. The follow-up research found that students in the accelerated experience were retained and succeeded at substantially higher levels than students the traditional sequence of courses.30
In the mathematics discipline campus research of the flow and success of basic skills students through the curriculum sequence determined that on average 6% of the students starting four levels below and 36% of those starting two levels below a transferable course succeeded in a transferable math course.31 The acceleration experimentation in math involved a very small number of students, but the campus research concluded that these students were retained and succeeded at substantially higher levels than students taking the traditional basic skills curriculum path.32
When the accountability framework was redesigned to become the Scorecard a separate metric was created for career and technical education (CTE).
In this analysis the years represent the academic year in which the student entered a community college for the first time. To qualify into the cohort a CTE student must, within three years, complete a CTE course for the first time and then complete more than eight units in a single discipline over the next three years. The numerator in the rate calculation is the number of those qualified students who within six years of entering a community college achieve any one of the following: (1) earn a Certificate of Achievement; (2) earn an Associate Degree; (3) complete a transfer to a four-year institution; or (4) become transfer prepared by GPA and earning 60 transferable units.
For CTE students the success rate between these two cohorts has increased by 4%. The greatest gain (15%) was among Hispanic students.
![]()
30 Gavilan College, Office of Institutional Research. Acceleration English 2013-14 Report. August 2014 and English Basic Skills Cohorts Acceleration 400 Placed in 200 Level. August 16, 2016.
31 Gavilan College, Office of Institutional Research. Math Acceleration Results. November 17, 2016.
32 Gavilan College, Office of Institutional Research. Acceleration English 2013-14 Report. August 2014
Chart 33: Career and Technical Education Student Success
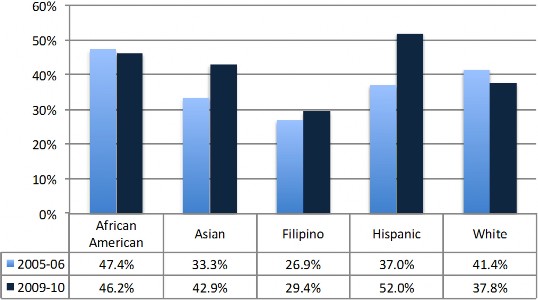
Source: California Community College Chancellor’s Office, 2016 Scorecard Report; analysis by Cambridge West Partnership, LLC
Particularly for the CTE students, but also for all students the aspiration to attend and succeed in the college experience is in part related to improving the prospects of entering the workforce employed in a field of endeavor that is desired by the student. Although it is not part of the Scorecard framework, the California community college system has developed a reporting tool to demonstrate the efficacy of attending and completing a program of study. The methodology uses the California Employment Development Department Unemployment Insurance (UI) wage data combined with the community college system student records of awards conferred upon students.
Students included in the reporting have received an award anytime over eight consecutive academic years (2002-03 to 2009-10). In addition, the students could not have transferred to a four-year institution, must be older than 21 at the time of the award, and could not be enrolled anywhere in the California community college system after receiving an award.
After combining the eight award cohorts into a single group, the median wage was calculated for the combined cohort by TOP code representing their field of study. The median wages do not represent any single year. Instead, it is the combined median wages for multiple award cohorts. The median wages at three years after completing the award, adjusted for inflation, are displayed in the following table.
In assembling this data the Chancellor’s Office acknowledges that students whose employment is not covered by the California EDD UI system are not included nor are students who do not have an SSN. Also, the numbers of hours an individual worked (full- time vs. part-time) is not known. Nevertheless, the table below provides some insight as
to the success of those former Gavilan College students who completed an award and “transferred to work.”
Table 45: Gavilan College Students With An Award Who Go Directly To Work
Award Year 2002-2003 - 2009-2010
Taxonomy of Programs Title & Code Award Categories
Median Wage 3 Years After Award
Total Awards
Award to Wage Match Rate
Business and Commerce, General-050100 | AA/AS Degree Recipient | $41,853 | 17 | 71% |
Cosmetology and Barbering-300700 | Chancellor's Office Approved Certificates | $23,535 | 47 | 57% |
Health Professions, Transfer Core Curriculum-126000 | AA/AS Degree Recipient | $36,670 | 16 | 88% |
Liberal Arts and Sciences, General-490100 | AA/AS Degree Recipient | $43,101 | 26 | 81% |
Licensed Vocational Nursing-123020 | AA/AS Degree Recipient | $70,366 | 19 | 89% |
Registered Nursing-123010 | AA/AS Degree Recipient | $110,638 | 70 | 96% |
Transfer Studies-490110 | AA/AS Degree Recipient | $28,803 | 47 | 79% |
Source: California Community College Chancellor’s Office, College Wage Tracker; analysis by Cambridge West Partnership, LLC
Trustees at Graduation Day, 2016
Some students attending the College are already established in their occupations, but believe they need or want some additional education. Those students enroll at the College for only a few courses and have become known as skill-builder students. The median percentage change in wages for students who completed higher level CTE coursework then left the system without receiving any type of traditional outcome such as transfer to a four-year college or completion of a degree or certificate has been used as another outcome measure of institutional effectiveness. In the following table the data on these former Gavilan College CTE students is displayed.
Table 46: Skill Builder Students Wage Gains
Median Percentage Wage Change One Year Before vs. One Year After Last Year of Attendance*
Last Year of Attendance
Discipline Studied and TOP Code 2008-09 2009-10 2010-11 2011-12 2012-13 2013-24
Accounting-050200 | 3.3 | 5.2 | 21.0 | 10.9 | 14.5 | 36.4 |
Administration of Justice-210500 | 3.0 | 0.3 | -0.6 | 0.9 | 1.0 | 11.2 |
Business and Commerce, General-050100 | -2.5 | |||||
Carpentry-095210 | -29.9 | 1.4 | 43.8 | 63.1 | 46.0 | 57.3 |
Certified Nurse Assistant-123030 | 71.1 | |||||
Child Development/Early Care and Education-130500 | 4.2 | 0.4 | 22.4 | 20.2 | -0.6 | 27.6 |
Computer Programming-070710 | 12.1 | 20.5 | 32.5 | 6.8 | 47.0 | |
Corrections-210510 | -34.6 | 0.6 | 139.2 | 71.0 | ||
Cosmetology and Barbering-300700 | -9.2 | |||||
Desktop Publishing-061450 | -12.2 | 39.6 | ||||
Drywall and Insulation-095280 | -31.5 | 10.7 | 66.1 | 25.2 | 23.3 | |
Emeergency Medical Services | 5.3 | |||||
Fire Technology-213300 | 11.7 | -17.5 | 6.8 | -6.9 | -3.4 | |
Gavilan Overall | 1.3 | -1.2 | -0.4 | 1.3 | 3.7 | |
Information Technology, General-070100 | 4.1 | 47.1 | 21.4 | |||
Licensed Vocational Nursing-123020 | 58.5 | 9.7 | 17.3 | 91.1 | ||
Medical Office Technology-051420 | 9.1 | |||||
Office Technology/Office Computer Applications-051400 | -10.6 | 21.3 | 34.3 | 13.6 | 14.8 | 29.6 |
Police Academy-210550 | 1.2 | -3.2 | -4.1 | -0.4 | 5.5 | 10.9 |
Real Estate-051100 | 5.6 | |||||
Water and Wastewater Technology-095800 | 25.8 | 12.8 | ||||
Website Design and Development-061430 | 10.9 | 16.5 | 47.1 | 25.3 |
Total Number of Students 1,396 2,269 1,395 1,066 1,313 1,011
*Excludes individuals employed by the military or federal government, self-employed, employed out of state, or unemployed.
Those included did not earn a certificate, degree, or transfer to a four-year college. At least 10 students must be in the cohort to be reported.
Source: California Community College Chancellor’s Office, Data Mart Skills Builders Query; analysis by Cambridge West Partnership, LLC
The College has adopted five Institutional Learning Outcomes and established a plan to systematically collect evidence of student work that was assessed by the faculty and discussed. Those general education and institutional student learning outcomes are:
1.1. Students will communicate effectively in many different situations, involving diverse people and viewpoints.
1.2. Speaking: Students will speak in an understandable and organized fashion to explain their ideas, express their feelings, or support a conclusion.
1.3. Listening: Students will listen actively and respectfully to analyze the substance of others' comments.
1.4. Reading: Students will read effectively and analytically and will comprehend at the college level.
1.5. Writing: Students will write in an understandable and organized fashion to explain their ideas, express their feelings, or support a conclusion.
2.1. Students will think logically and critically in solving problems; explaining their conclusions; and evaluating, supporting, or critiquing the thinking of others.
2.2. Analysis and Synthesis: Students will understand and build upon complex issues and discover the connections and correlations among ideas to advance toward a valid independent conclusion.
2.3. Problem Solving: Students will identify and analyze real or potential problems and develop, evaluate, and test possible solutions, using the scientific method where appropriate.
2.4. Creative Thinking: Students will formulate ideas and concepts in addition to using those of others.
2.5. Quantitative Reasoning: Students will use college-level mathematical concepts and methods to understand, analyze, and explain issues in quantitative terms.
2.6. Transfer of Knowledge and Skills to a New Context: Students will apply their knowledge and skills to new and varied situations.
3.1. Students will use printed materials, personal communication, observation, and electronic resources to find and evaluate information.
3.2. Research: Students will do research at a level that is necessary to achieve personal, professional, and educational success.
3.3. Technological Competency: Students will use technological applications to find, organize, and present information effectively.
4.1. Students will interact with individuals and within groups with integrity and awareness of others' opinions, feelings and values.
4.2. Teamwork: Students will participate effectively in teams, committees, task forces, and in other group efforts to make decisions and seek consensus.
4.3. Effective Citizenship: Students will take personal responsibility for being informed, ethical and active citizens of their community, their nation, and their world.
5.1. Students will produce or respond to artistic and creative expression.
6.1. Students will develop individual responsibility, personal integrity, and respect for diverse people and cultures.
6.2. Self-management: Students will demonstrate habits of intellectual exploration, personal responsibility and physical wellbeing.
6.3. Ethics and Values: Students will demonstrate an understanding of ethical issues that will enhance their capacity for making sound judgments and decisions.
6.4. Respect for Diverse People and Cultures: Students will respect and work with diverse people including those with different cultural and linguistic backgrounds and different abilities.
These institutional learning outcomes were systematically assessed in 2010 with a survey involving a stratified, randomly selected group of students. The total number of respondents was 635 or 10% of the enrolled students. There were two questions for each of the six intended outcomes and students were asked to report the extent of their perceived gain on each outcome. Content specific outcomes were not assessed.
Statistically significant gains were noted for several intended learning outcomes among the students who had completed 30 units or more. The following table summarizes those results.
![]()
Cambridge West Partnership, LLC
Table 47: Institutional Learning Outcomes Assessment Summary Results
Student Rating Regarding Extent of Improvement | Mean | Students With 30+ Units | |||||||||
ISLO Area | ISLO | Not At All | A Little | Much | Very Much | N | (5- Pt. Scale) | N | Mean | Signif. | |
Communication | Communicate well in many different situations, | 6.0% | 27.6% | 35.9% | 30.4% | 579 | 2.91 | 207 | 3.06 | Y | |
involving different people and viewpoints. | |||||||||||
Communication | Write in an understandable and organized way. | 4.0% | 24.5% | 41.0% | 30.6% | 556 | 2.98 | 207 | 3.14 | Y | |
Cognition | Think logically and critically to solve problems. | 3.2% | 24.6% | 40.5% | 31.7% | 556 | 3.01 | 211 | 3.12 | Y | |
Cognition | Use what you have learned in new situations | 5.0% | 22.1% | 43.6% | 29.3% | 598 | 2.97 | 214 | 3.18 | Y | |
Information Competency | Do research to successfully complete projects. | 4.0% | 23.4% | 36.6% | 36.1% | 552 | 3.05 | 205 | 3.19 | Y | |
Information Competency | Use technology to find and present information. | 8.2% | 23.0% 35.9% | 32.9% | 574 | 2.94 | 204 | 3.01 | Y | ||
Social Interaction | Participate in groups or teams. | 6.4% | 23.2% | 36.2% | 34.3% | 578 | 2.98 | 205 | 2.97 | ||
Social Interaction | Be informed about your community, your nation, | 7.0% | 34.5% | 34.5% | 24.1% | 586 | 2.76 | 202 | 2.72 | ||
and your world. | |||||||||||
Aesthetic Responsiveness | Make or critique art or other creative expression. | 20.1% | 28.2% | 32.2% | 19.5% | 543 | 2.51 | 189 | 2.66 | Y | |
Aesthetic Responsiveness | Make good decisions after considering the ethics | 8.0% | 23.7% | 43.2% | 25.0% | 539 | 2.85 | 204 | 2.88 | ||
or values of an issue. | |||||||||||
Personal Development & | Respect and work with people from different | 4.9% | 15.4% | 38.5% | 41.3% | 572 | 3.16 | 204 | 3.20 | ||
Responsibility | cultures and backgrounds. | ||||||||||
Y= statistically significant change | |||||||||||
110
Source: Gavilan College, Office of Institutional Research Institutional Outcomes Report. Spring 2010
As listed in the narrative, found in the internal scan chapter of this Plan, the College has a number of traditional student support services in place. Appendix D provides a summarized overview of these online services and forms available to students. In addition to these programs and services the College has made an extra effort to acquire additional grant resources to support innovative approaches to promoting student success (see Appendices PM, Grant-Funded Intervention Summaries, and Grant-Funded Interventions: Crosswalk of Major Intervention Effort Attributes).
Grant Resources to Support Interventions
TRiO Student Support Services Grant Highlights
In August 2015 the College was awarded a five-year renewal of the TRiO Student Support Services grant. The programs and services supported by the grant assist first- generation, low-income, and/or students with disabilities as they pursue an associate degree and/or transfer.
Table 48: TRiO Grant Services
Specialized academic counseling and guidance | Career and personal development |
Priority registration | Summer Bridge program |
TRiO financial grants | Laptop and calculator loans |
Financial aid application assistance | University campus visits |
Informational workshops | Cultural activities |
Source: Gavilan College. TRiO Program web page. Retrieved March 10, 2017 from http://www.gavilan.edu/student/trio/mission.php
Summer Bridge has been a very successful initiative. It helps recently graduated from high school incoming students to transition so that they can be successful students at Gavilan College. Participating students advance in their mathematics coursework, develop skills to be successful students, and become part of a support community. In the 2015 and 2016 Summer Bridge programs 50-56 % of the students tested in mathematics one to four course levels above the level where they had initially tested. A summary of the past activities is found in Appendix Grant-Funded Intervention Summaries.
Mathematics, Engineering, Science Achievement (MESA) Grant
The California MESA program is supported by grant funds from the Chancellor’s Office that are annually renewable based upon performance of the program at each college. This program provides academic development to educationally disadvantaged community college students so they will excel and transfer to four-year institutions in calculus-based majors in science, technology, engineering, and math (STEM) disciplines. MESA uses a holistic model in which multiple program components form a symbiotic relationship to ensure academic achievement. It provides both a set of services and a culture for a community of students majoring in the STEM disciplines.
Academic excellence workshops and tutoring provide the means for students to strive for high academic standards through group learning with faculty and facilitator mentors. The collaborative approach allows students to master highly technical material, complex concepts, and develop effective critical thinking skills. Students are assigned by the subjects being taught, to study groups to help them master course material.
Academic support and advising is provided to participants by faculty, tutors, and counselors.
A study center provides students with access to a dedicated meeting and a study area.
Counselors dedicated to the MESA program provide transfer service assistance.
Career development activities and workshops are used to help students gain leadership skills, learn about career options, and explore internship and summer employment opportunities.
A summary of the past activities is found in Appendix Grant-Funded Intervention Summaries.
Basic Skills Initiative (BSI), Student Equity (SE), and Student Success and Support Program (SSSP) Grants
To achieve greater student success the College has used a combination of resources from the Basic Skills Initiative (BSI), Student Equity (SE), and Student Success and Support Program (SSSP) funding. These three programs share a common goal to increase student success while closing achievement gaps among subgroups of students. There is a strong potential for overlap between and among the programs. In July 2016 the Chancellor’s Office acknowledged the overlap observations and recognized that many colleges were experiencing planning fatigue because they were required annually to write three separate action and expenditure plans. The requirement to submit plans for fiscal year 2016-17 was suspended while the staff at the Chancellor’s Office investigated how to merge the three into one plan and encouraged the colleges to dialogue regarding the three initiatives.
At the beginning of 2016 an Integrated Planning Task Force was developed to establish better connections among the planning processes of the College. The College Task Force developed a crosswalk of intervention initiatives, a portion of which (purposes, focus, and students to be served) has been included as Appendix Grant-Funded Interventions: Crosswalk of Major Intervention Effort Attributes. The Chancellor’s Office now expects an integrated plan to be submitted by December 2017 and has promised to provide data analysis tools to assist the colleges. The kinds of data the colleges are to consider and the goal topics that are expected have not changed.33 The primary findings and attributes of these three current College plans are summarized in the following narrative.
![]()
33 Walker, Pamela, Vice Chancellor for Educational Services, Chancellor’s Office California Community Colleges, Basic Skills Initiative, Student Equity Program, and Student Success and Support Program Integrated Planning Documents and Related Guidance Memorandum. AA 17-12?SS 17-04, February 15, 2017.
The new funds provided through these three categorical grants have allowed the College to recruit, train, and assign a number of staff specialists to carry out the planned interventions. Without the additional resources the augmented staffing would not have been possible.
Basic Skills Initiative Grant Plan Highlights
The College has been receiving support for basic skills instruction based upon the FTES generated from that category of curriculum offerings representing two levels of courses below the transfer level in math, ESL and English. Efforts became more focused when a college-wide committee assessed needs. Several curriculum modifications were implemented. ESL created some vocational English as a Second Language courses. Math created an immersion or accelerated strategy. And English integrated reading and writing instruction.
Tutors and counselors were embedded in the classroom to provide academic support and to offer workshops covering a variety of study strategies. The metacognitive material in Habits of Mind Mindset was implemented as a web-based resource and also provided as faculty professional development. A reading across the curriculum through the reading apprenticeship strategy was implemented.
Funds from a STEM and a Title V grant were used to augment these efforts at a larger scale and an early alert program was launched. Counselors working in the Success Center were able to provide one-on-one “whole student” counseling. The AEBG regional consortium provided resources for the non-credit students and adult basic education boot camps. Enrollment in high school equivalency and high school diploma courses has increased. A summary of the past activities and proposed interventions for the Transformation Grant is found in Appendix Grant-Funded Intervention Summaries.
Student Equity Grant Plan Highlights
In December 2014, Gavilan College updated its Student Equity Plan. To do so, a committee of faculty, staff, administrators, and students collaborated with the Office of Institutional Research (OIR) to research the current state of equity at the College, discuss issues, and propose solutions for subsequent years. Their findings regarding disproportionate impact are summarized in the following table.
Table 49: Student Equity Outcomes, At Risk Groups
Completion
Group Showing Inequity
Course
Completion Transfer Access
ESL/Basic Skills
Degree/ Certificate
Low income | X | ||
Foster Youth | X | ||
Hispanic | X | ||
Disabled | X | ||
20 - 24 years old | X | ||
25 - 49 years old | X |
Source: Gavilan College. Student Equity Plan. December 9, 2014
To alleviate the demonstrated areas of inequity at the College, the Gavilan student equity committee proposed several goals and initiated corresponding programs and activities in the indicator areas of Course Completion and Transfer. 34 A summary of the activities proposed is found in Appendix Grant-Funded Intervention Summaries.
Course Completion
The first and most significant goal in this area is to “reduce the difference between low income and average student course completion rate by 2% points annually through AY 2016/2017.”
The second goal in this area is to “reduce the difference in course completion rate between Foster Youth students and the college average by 5% points.”
Transfer
The first goal in this area is to “reduce the difference between Hispanic-American student transfer rate and the college average by 4.5% points.”
The second goal in the Transfer area is to “reduce the difference in transfer rate between students with disabilities and the college average by 5% points.”
The third goal in this area is to “reduce the difference between student transfer rate for those 20 and older students and the college average by 5% points.”
The fourth and final goal in this area is to “reduce the number of Veterans who do not complete 60 transferable units by 5%.”
A summary of the proposed future actions is found in Appendix Grant-Funded Intervention Summaries.
![]()
34 Gavilan College, Student Equity Plan. December 9, 2014
Credit Student Success and Support Program Plan Highlights
In fall 2015, the College submitted its Student Success and Support Program (SSSP) Plan, which outlines the goals it has established for the future and steps it has taken since the previous academic year to increase student success and achievement. The SSSP committee, cooperating with the Student Equity, and Basic Skills committee, constructed the SSSP Plan. With the goal of ensuring student success the committee members engaged in dialogue, research, and planning. There are four core services on which the SSSP Plan is focused: 1. Orientation, 2. Assessment for Course Placement, 3.
Counseling, Advising, Education Planning Services, and 4. Follow-up for At-Risk Students. Most 2015-16 planning is centered on Orientation and Counseling, Advising, Education Planning Services.35 A summary of the proposed activities is found in Appendix Grant-Funded Intervention Summaries.
Orientation
Significant initiatives undertaken in the 2014-15 year focused on developing a multifaceted pathway process for new student success
Assessment for Course Placement
Significant initiatives from the 2014-15 year were sparse, as the College mostly persisted to place students with its already existing assessment structure. That structure utilizes Accuplacer online assessments in tandem with other measures, including student background data, standardized test scores, and counselor interview.
In accordance with the Multiple Measures Assessment Project (MMAP) underway Statewide, Gavilan College tested a homegrown MMAP process pilot using a cohort of students identified in spring 2016. Using multiple measures assessment procedures students were placed according to a variety of data points. Though small in number, results of the MMAP pilot were extremely encouraging. Success rates for multiple measures placed students compare favorably with their traditionally placed peers. The College Office of Institutional Research recommended expansion of multiple measures placement.36
Counseling, Advising, and Other Education Planning Services
Significant initiatives from the 2014-15 year were numerous. Counseling services off site were expanded and on-campus appointments were increased. The MyDegreeWorks software for educational planning was updated and technology was used to generate automatic notifications to student who had not completed required enrollment procedures. Also, a change of major form was placed online.
Follow-up for At-Risk Students
Significant initiatives in the 2014-15 year focused primarily on moving towards automation and streamlined communication.
![]()
35 Gavilan College. Credit Student Success and Support Program Plan 2015-16. October 30, 2015.
36 Gavilan College, Office of Institutional Research. MMAP Pilot Evaluation Project. January 18, 2017.
Non-Credit Student Success and Support Program Grant Plan Highlights
The 2015-16 Non-Credit SSSP Plan outlines the approach the College’s non-credit programs take in order to meet their SSSP responsibilities in 1. Orientation, 2.
Assessment and Placement, 3. Counseling, Advising, and Education Planning Services, and 4. Follow-up for At-Risk Students. The plan does not focus on goals or pending initiatives for future years, and rather describes the current state of the services and programs already in place at the College.37 A summary of the proposed activities is found in Appendix Grant-Funded Intervention Summaries.
Orientation
Orientation activities take place before the start of each term with a series of new non- credit student orientation programs, which present information on the courses, requirements, and services available for non-credit students. The total audience for all orientations throughout the term is approximately 200 students, with most being ESL students.
Assessment and Course Placement
Non-credit students are assessed and placed using the computer-based Comprehensive Adult Student Assessment System (CASAS), known as E-CASAS, and CASAS oral assessment tools. Approximately 400 new students, primarily English language learners interested in vocational and/or life skills, are assessed each academic year.
Counseling, Advising, and Other Education Planning Services
The non-credit counselor initially establishes connection with non-credit students through a brief conversation at orientation events. Subsequently throughout the term the non- credit counselor has a regular rotation of visits at each of the 15 community-based non- credit education sites. During the visits the counselor provides advising and helps non- credit students develop their education plans. Education plans are made using DegreeWorks software. Appointments are not required for these meetings.
Approximately 1,000 students non-credit students are the audience for these counseling and advising visits. The focus is on the approximately 200 new students each term.
Follow-up Services for At-Risk Students
The non-credit counselor, on regular rotation to non-credit education sites, undertakes follow-up services for the non-credit students. The counselor targets students who have not yet submitted their education plans and meets with these students individually to advise and refer them to planning and support services.
Career and Technical Education Earmarked Grant Funds Highlights
In the 2014-15 budget the State provided one-time funds for community colleges to enhance their career and technical education programs through curriculum development, equipment purchases, or professional development for faculty and staff. The College was able to assist six programs with these funds. The effort was largely to coordinate alignment of curriculum across the region, develop new curriculum, revise programs,
![]()
37 Gavilan College. Non-Credit Student Success and Support Program Plan. September 30, 2015.
retool/equip some programs, and provide professional development for faculty members.38
California Career Pathways funding (SB 70/1070) was used to host a dual enrollment workshop and California Career Pathways Trust Fund (CCPT) resources were used to partner with West Valley College as the local education agency for the water programs focus of those regional efforts. A CTE Transitions grant was focused upon outreach/career exploration, articulation, credit-by-exam, and activities such as visits to the college campus and career days that would to help students become interested in attending college and assist them to migrate from secondary to postsecondary education then into the world of work.
The Vocational Education Training Authority (VETA) or Carl D. Perkins federal grant program is to improve career and technical education (CTE) programs serving special populations and seeking to meet gender equity needs. The funds are awarded to the Chancellor’s Office then passed through to the College based on student population numbers in the CTE programs. The College has devoted these funds to supporting several programs that lead to high paying jobs: (1) Aviation Maintenance, (2) Child Development; (3) Cosmetology; and (4) Certified Nursing Assistant. Support has been used for equipment purchases, professional development, and curriculum revision. These funds cannot replace regular College funding for CTE programs. A summary of the past and proposed future activities is found in Appendix Grant-Funded Intervention Summaries.
Adult Education Block Grant Highlights
In 2013-14 the state provided funds for community colleges and adult schools to form consortia and plan for more coordinated delivery of key services to adults in the service area. The College took the leadership roles as fiscal agent and consortium chair for its region. The consortium, named the Academic and Career Education Services (ACES), consists of the College and representatives from the following public school districts: Morgan Hill Unified School District, Gilroy Unified School District, San Benito High School District, Aromas-San Juan School District. In 2015 the Legislature established a mechanism for block grant funding to support the action plans of the consortia.39 A summary of the past and proposed future activities is found in Appendix Grant-Funded Intervention Summaries.
The long-range goals of the ACES effort are as follows:
Evaluate the current levels and types of adult education programs within the region, including education for adults in correctional facilities; credit, non-credit, and enhanced non-credit adult education coursework; and programs funded through Title II of the federal Workforce Investment Act (Adult Education and Family Literacy Act, Public Law 05-220).
Evaluate the current needs for adult education programs within the region.
![]()
38 Gavilan College. CTE Enhancement Fund Final Report. April 21, 2016
39 Gavilan Regional Academic and Career Education Services. Final Plan. March 1, 2015 and AB104 Adult Education Block Grant Three-Year Consortia Plan Update from AB86 Final Plan. October 26, 2015.
Create plans for consortium members and partners to integrate existing programs and create seamless transitions into postsecondary education or the workforce.
Create plans to address the gaps identified through goals one and two above.
Create plans to use approaches proven to accelerate student progress toward academic or career goals, such as contextualized basic skills and career technical education.
Develop other joint programming strategies between adult education and career technical education.
Create plans to collaborate in the provision of ongoing professional development opportunities for faculty and other staff to help them achieve greater program integration and improve student outcomes.
Create plans to leverage existing regional structures, including, but not limited to, local workforce investment areas.
The College has made an extraordinary effort over many years to acquire major federal competitive grant resources to support well-established approaches to promoting student success. The institution has been awarded three grants to undergird science, technology, engineering, and mathematics (STEM) curriculum and students. The College has also received two Title V grants to develop Hispanic-serving institutions.
Science, Technology, Engineering, Math (STEM) Magnet Improving Pathways for Hispanic/Low-Income Students in Hispanic-Serving Institutions Title III Grant 2011- 2016 Highlights
This STEM and articulation co-operative grant with San Jose State University (SJSU) concluded in 2016-17. A summary of the activities/interventions supported by this major grant is found in Appendix Grant-Funded Intervention Summaries. The grant had been used to pursue the following major service strategies:
Part 1: STEM Pathways
Create STEM awareness activities as a magnet outreach effort.
Streamline five aligned majors.
Provide faculty professional development for new studio curricula.
Part 2: Increase STEM Support
Develop accelerated basic math sequences.
Retain a STEM counselor to provide case management services.
Create an intensive summer math institute as a practice bridge venue.
Part 3: Strengthen STEM Curriculum
Provide faculty professional development to update and test new instructional methods.
Create hands-on research internship projects.
Re-design and update the engineering curricula.
Introduce a new environmental science major to engage students.
Science, Technology, Engineering, Math (STEM) Hispanic-Serving Institutions Title III Grant 2016-2021 Highlights
In 2015-16 the College assembled the STEM Planning Group to prepare an application for a third STEM grant. In November 2016, the College received the Hispanic-Serving Institutions Title III STEM grant for $4.7 million to be spent over five years.
The official name of the grant indicates its major themes- Strengthening Hispanic STEM Students: Comprehensive Support, Guided Pathways, and Renewed Learning.40 A summary of the activities/interventions proposed in this major grant is found in Appendix Grant-Funded Intervention Summaries.
The grant is dedicated to achieving three broad goals:
Improve STEM student outcomes.
Increase guided pathway success.
Increase teaching-learning opportunities.
The interventions proposed include the following.
Increase the effectiveness of STEM student supports by centralizing and broadening fragmented support services.
Strengthen STEM pathways to transfer by streamlining degree requirements.
Renew STEM teaching & learning opportunities for students and faculty members.
Title V Co-operative Grant with Hartnell College, Gavilan College, and California State University at Monterey Bay (2012-2017) Highlights
This Title V Co-operative Grant with CSU Monterey Bay (CSUMB) and Hartnell College is concluding in 2017. The co-operative grant focused on Hispanic students interested in career and technical majors in nursing, digital media, and computer science. A summary of the activities/interventions supported by this major grant is found in Appendix Grant-Funded Intervention Summaries.
The grant had three shared goals that were collaboratively addressed problems:
Academic Programs: To develop three career and technical education transfer pathways to CSUMB that will increase the transfers and degree completers from both Hartnell and Gavilan.
Institutional Management: To increase the quality and quantity of data available to evaluate and improve the career and technical education pathway and train faculty and students to track student outcomes.
Fiscal Stability: To provide services to more career and technical education transfer pathway students at no additional operating cost and to reduce technology costs with open-source resources.
![]()
40 Gavilan College. STEM 2016 Proposal Strengthening Hispanic STEM Students: Comprehensive Support, Guided Pathways, Renewed Learning. 2016
Title V Developing Hispanic-Serving Institutions Grant (2015-2020) Highlights
The College successfully applied for a federal U.S. Department of Education Title V- Developing Hispanic-Serving Institutions grant in 2014 and received $2.6 million to be spent over five years. The grant activities address the gap in college transfer and completion that has been noted between Hispanic and non-Hispanic students. The grant’s overall goal is to raise the level of student engagement in community and academic life to increase success, retention, completion, and transfer. A summary of the activities/interventions in this major grant is found in Appendix Grant-Funded Intervention Summaries.
This Title V grant is dedicated to achieving four broad intervention goals:
Improve student outcomes for Hispanic and high-need students.
Improve the access to and quality of online programs.
Improve civic engagement education.
Strengthen faculty teaching-learning skills.
A variety of intervention activities were proposed in the 2014 grant application.
For goal one the Learning Commons facility is the primary venue for services provided through the grant-supported interventions. The services to faculty are professional development to teach accelerated basic skills courses and develop directed learning activities for students. A part-time bi-lingual counselor was hired. Training for tutors has been conducted. A nationally well-known and regarded program to help students develop critical thinking and writing skills for upper-division curriculum, the Academy for College Excellence (ACE), is being considered. In collaboration with the California Career Ladders organization the College is also intending to implement guided pathways framework.
For goal two grant-support interventions the Teaching-Learning Center is the primary venue for providing services. Professional development has been extended to staff at the distance education helpdesk with an eye to honing their expertise and interpersonal skills. Professional development has been offered to two cohorts of six faculty each a year who want to develop new online or hybrid courses and to experienced online teaching faculty members who want to improve the quality of their course designs and pedagogy.
Civic engagement is being improved by linking community service to the curriculum through service learning internships and problem-based learning assignments. Also, a civic leadership certificate was established. The College modeled these efforts on the Service Learning Institute at CSU Monterey Bay.
The fourth goal, strengthening faculty teaching-learning skills, serves all three of the other goals through the development of innovative classroom approaches. The interventions are intended to facilitate and incentivize faculty participation through these annual steps.
Add six faculty members per year who are equipped to teach accelerated basic skills.
Introduce ten directed-learning activity pilot assignments per year.
Provide professional development in online/hybrid course design and pedagogy to six faculty members per year.
Ongoing Resources to Support New Interventions
The 2016-17 budget contained $200 million earmarked for career and technical education programs. These funds were intended to be on-going, base-budget support for CTE programs in recognition of the high cost to offer many of the programs as opposed to the typical cost for instruction in traditional liberal arts subjects. Sixty percent of the regional funding was allocated for college-specific programs while 40% was earmarked for
region-wide projects. The College is using its share of those funds to hire a counselor and senior program specialist. The funds also will support college-specific program development in these new areas:
Heating, Ventilation, and Air Conditioning (residential)
Phlebotomy
Hospitality (retail and tourism)
Unmanned Aircraft Systems (drones)
Regional projects in which the college will participate include program development for these areas: 41
Heating, Ventilation, and Air Conditioning (residential)
Paramedic
Unmanned Aircraft Systems (drones)
Cyber Patriot (summer camp)
Over the last two years discussions in the Learning Council, and elsewhere on campus, have turned to the importance of addressing the needs of the whole student. Examples of the initiatives that have been undertaken from these discussions include:
The establishment of a food pantry.
The Fresh Success pilot program for students who are on food stamp assistance.
More support for the undocumented students known as Dreamers.
A mental health education and support effort for students who are experiencing stressful circumstances. A mental health counselor was contracted to be on campus once a week and is also placing greater emphasis on educating staff and faculty to the importance of mental health as it relates to student success.
Establishment of a Veterans’ Center
Efforts to help foster youth include the hiring of a foster youth designated counselor and a liaison within the EOPS office
Creating of a Student Ambassador program
Development of a Student Center advisory group.
Provision of a web-based training program, Kognito Interactive that educates students, faculty, and staff so they could help students at risk.
Provision of a web-based training program on prevention of sexual assault, dating and domestic violence, or stalking.
![]()
41 Sherrean Carr, Career and Technical Education Dean, Personal Correspondence. March 7, 2017.
Within Santa Clara, Santa Cruz, San Benito, and Monterey Counties roughly 48,000 annual job openings are projected between 2014-2024 due to retirements and new jobs created through growth in the economy. As is commonly the case, most of the openings require a high school diploma or less education for entry, but 35% of the anticipated occupational openings require a Bachelor’s degree or higher for entry. Many of these occupations are detailed in the tables found at Appendix JOBS.
Occupations with the most job openings are forecasted to generate more than 263,1808 jobs, roughly 55% of all job openings. The top non-farm occupations with the most openings are: (1) software developers, applications; (2) retail sales persons; (3) cashiers;
(4) combined food preparation and serving workers; (5) waiters and waitresses; and (6) personal care aides. However, other than software developers, the median wage for these jobs ranges from $9 to $13 per hour. The 50 fastest-growing occupations will provide a growth rate of 26% or higher. Thirty-one percent of these are in computer and mathematical occupations and thirteen percent are in food preparation and service related occupations.
The portion of projected annual average job opening employment opportunities for graduates of the community college in the South San Francisco Bay (Santa Clara, San Benito, Santa Cruz, and Monterey counties) area are similar to those in other urban/suburban areas of the state, except for the Bachelor’s and higher educational levels. The Bachelor’s degree entry-level occupations projected for San Benito-Santa Clara Counties is 37% (13,920 / 37,170) of the annual average job openings in those counties. The next highest county, San Francisco, is 29% or 8% below Santa Clara-San Benito for the 2014-24 projection.
Table 50: South Bay Counties Projected Annual Job Openings 2014-2024
Average Annual Total Job Openings 2014-2024
Entry Level Education Monterey
Santa Cruz*
San Benito_
Less Than high School | 4,144 | 1,400 | 10,191 | 15,735 | 32.7% | |
High School Diploma or Equivalent | 1,881 | 1,098 | 8,543 | 11,522 | 23.9% |
Santa Clara Total % of Total % of Total
Subtotal 56.6%
Median Annual Wage 2016
![]()
$30,591
$46,474

Subtotal
8.4%
Some College, No Degree | 75 | 51 | 623 | 749 | 1.6% |
Postsecondary Certificate | 350 | 109 | 1,352 | 1,811 | 3.8% |
Associate's Degree | 93 | 131 | 1,250 | 1,474 | 3.1% |
$44,749
$52,488
$64,725
Bachelor's Degree | 886 | 506 | 13,920 | 15,312 | 31.8% |
Master's Degree | 78 | 54 | 507 | 639 | 1.3% |
Doctoral or Professional Degree | 109 | 40 | 784 | 933 | 1.9% |
Subtotal
35.0%
$85,430
$79,544
$111,632
Totals 7,616 3,389 37,170 48,175
*Santa Cruz projection data is 2012-2022
Source: California Employment Development Department, Labor Market Information; analysis by Cambridge West Partnership, LLC
Across the state these general patterns of job openings related to expected level of education for entry positions are repeated. However, the general San Francisco Bay area is distinctive with respect to the larger portion of openings that require a Bachelor’s degree. Additional comparative details are found in Appendix JOBS.
In an effort to identify new program areas that would meet labor market needs in any of the South Bay Counties, an analysis was completed of the occupations expected to provide 50 or more job openings annually through 2024. The list was sub-divided using the Bureau of Labor Statistics’ training-level definitions with a focus on those occupations requiring between a high school diploma and a bachelor’s degree. The most promising occupations are those with the highest number of projected annual average total jobs. The tables were sorted in descending order on that data column and are located in the Appendix JOBS of this Plan.
Using the Standard Occupational Classification (SOC) codes and Taxonomy of Programs (TOP) codes the occupations that meet the criteria were mapped, to Associate Degree and Certificate of Achievement programs offered by the College and nine other community colleges in the region (Cabrillo, Hartnell, Monterey Peninsula, Evergreen Valley, San Jose City, Mission, West Valley, De Anza, and Foothill). In each table the TOP code has been placed in bold if Gavilan College has an established program of study that is aligned to the occupation.
Because some of the occupations mapped to more than one of the TOP codes used by the community college system, there can be multiple programs using different TOP codes offered for each occupation. For that reason, some of the occupations have more than one row in the tables. Details regarding the requisite knowledge, skills, and abilities for each occupation can be found at the U.S. Bureau of Labor Statistics website https://www.onetonline.org.
Middle-skills occupations are defined as those that require more than a high school diploma but less than a Bachelor’s Degree as preparation for entry-level positions. The EDD, Economic Modeling Specialists International (EMSI), and the Centers of Excellence labor market database projects 22,500 new middle skills occupations job openings as the average annual count from 2015 to 2018 in the Santa Clara, San Benito, Santa Cruz and Monterey County region.42
An inventory of the instructional programs offered by Gavilan College and a count of awards granted to students is found in the GAVData resource located through the web page of the Office of Institutional Research. The most popular fields of study at Gavilan College for a degree are Health Professions and Liberal Studies and for a certificate of achievement it is the CSU and IGETC patterns. Gavilan College offers 21 instructional programs that were a direct match to occupations requiring a bachelor’s degree. The College offers eight instructional programs that were a match to occupations requiring an
![]()
42 Centers of Excellence. Labor Market Information, Occupational Projections for Santa Clara, Santa Cruz, San Benito, and Monterey Counties. Retrieved March 21, 2017 from http://www.coeccc.net/Supply- and-Demand.aspx
Associate Degree. The following table, organized by level of education expected for entry-level positions in the South Bay Counties region, provides summary counts of the occupations and College programs available.
Table 51: Occupations By Level of Education and Gavilan College Program Coverage
Bachelor's | 28 | 21 | 75% |
Associate | 8 | 4 | 50% |
Certificate | 7 | 3 | 43% |
Some College | 3 | 1 | 33% |
Total 46 29 63%
*and a community college program TOP code is established somewhere in the state
Source: California Employment Development Department, Labor Market Information and California Community College Chancellor Office, Academic Affairs Program Inventory; analysis by Cambridge West Partnership, LLC
Some of the programs of study offered by the College are intended to facilitate transfer to a California State University (CSU) campus. The Legislature enacted and the Governor signed the Student Transfer Achievement Reform Act (SB 1440) in September 2010 in an effort to streamline transfer to the California public university system where most California community college students migrate. The act enables these two public systems to collaborate on the creation of Associate Degree transfer (AD-T) programs. Upon completion of the Associate Degree, the student is eligible for transfer with junior standing into the CSU system with guaranteed admission and priority consideration when applying to a particular program of study that is similar to the student’s community college major.
The Most Popular California State University (CSU) Majors
The following table lists some of the most popular CSU majors. As of fall 2016 there were 36 transfer model curriculums (TMC) upon which the faculties of the community college and CSU systems had agreed. Three of the thirty-six are uniquely appropriate for more rural community colleges with an agriculture curriculum. An updated, complete listing is available at this C-ID URL https://c-id.net/degreereview.html.
The extent of curriculum alignment between the programs of study at the College and some of the most popular fields of study throughout the California State University (CSU) where transfer model curricula have been established is noted in the following table.
Table 52: Associate Degrees for Transfer Established at Gavilan College
Administration of Justice | 210500 | X | 1 | |
Anthropology | 220200 | X | 1 | |
Art History | 100100 | X | 1 | |
Biology | 040100 | X | 1 | |
Business Administration | 050500 | X | 1 | |
Chemistry | 190500 | X | 1 | |
Communication Studies | 150600 | X | 1 | |
Computer Science | 070600 | X | 1 | |
Early Childhood Education (ECE) | 130500 | X | 1 | |
Economics | 220400 | X | 1 | |
Elementary Teacher Education | 490120 | X | 1 | |
English | 150100 | X | 1 | |
History | 220500 | X | 1 | |
Journalism | 060200 | X | 1 | |
Kinesiology | 127000 | X | 1 | |
Mathematics | 170100 | X | 1 | |
Music | 100400 | X | 1 | |
Philosophy | 150900 | X | 1 | |
Physics | 190200 | X | 1 | |
Political Science | 220700 | X | 1 | |
Psychology | 200100 | X | 1 | |
Spanish | 110500 | X | 1 | |
Studio Arts | 100200 | X | 1 | |
Theater Arts | 100700 | X | 1 |
Source: California Community College Chancellor’s Office, Academic Affairs Division. SB 1440 Legislation Update. September 28, 2016; interviews and analysis by Cambridge West Partnership, LLC
The Most Popular University of California (UC) Majors
In summer 2015, the University of California announced a new academic roadmap for California community college students who planned to transfer to a UC campus. It is intended to simplify the admissions process and help students better prepare for transfer to the university and graduate within two years of admission. Although the pathways curricular directions are not a guarantee of admission, they are intended to help the university achieve its goal of a 2:1 ratio of freshmen to transfer students.
The extent of curriculum alignment between the programs of study at Gavilan College and the 21 most popular fields of study throughout the University of California (UC) is noted below.
Table 53: Most Popular UC Majors and Associate Degrees for Transfer Established at Gavilan College
Transfer Model Curriculum (AD-T) UC Transfer Gavilan College AD-T Scorecard
Established at Chancellor's Office Pathway Established Faculty Interest Potential
Anthropology | X | X | 1 | |
Biology | X | X | 1 | |
Business Administration | X | X | 1 | |
Chemistry | X | X | 1 | |
Communication Studies | X | X | 1 | |
Computer Science | X | X | 1 | |
Economics | X | X | 1 | |
English | X | X | 1 | |
History | X | X | 1 | |
Mathematics | X | X | 1 | |
Philosophy | X | X | 1 | |
Physics | X | X | 1 | |
Political Science | X | X | 1 | |
Psychology | X | X | 1 |
Total 14 13 1 14
Source: Retrieved April 29, 2016 from Admission.universityofcalifornia.edu/transfer/preparation- paths/index.html; California Community College Chancellor’s Office, Academic Affairs Division. SB 1440 Legislation Update. June 22, 2016; interviews and analysis by Cambridge West Partnership, LLC
The College has a well-established curriculum review and approval process. A shared- governance Curriculum Committee provides oversight to the process that includes both a technical and a substantive review of new curriculum ideas. Faculty members and division instructional deans propose new courses and programs, the Curriculum Committee and College administration critique, evaluate, set priorities and recommend proposals to the Board of Trustees. The criteria used to evaluate the visions for future curriculum within the College are similar to those adopted by the Chancellor’s Office as discussed below.
Given the current California higher education public policy environment, priority should be given to programs intended for transfer preparation that have been developed around the Transfer Model Curricula (TMC). Priority should be given to career and technical education programs that fall within the primary areas of emphasis agreed upon through regional discussions. The labor market data analysis provided in the initial segment of this chapter and the evolving list of TMCs developed around the most popular majors within the CSU system point to the primary areas for future program development that would serve students well.
The Chancellor’s Office has a set of long-established criteria to use when evaluating new instructional program proposals. They encourage individual colleges and districts to use
the same or similar criteria when evaluating a curriculum proposal. Those five criteria are as discussed in the Program and Course Approval Handbook are:
Appropriateness to the Mission
Need
Curriculum Standards
Adequacy of Resources
Compliance
The Academic Senate for the California Community Colleges (ASCCC) provides useful additional information about best practices for curriculum development. Unless the web link has changed, curriculum resource materials are available as of spring 2017 at www.asccc.org/directory/curriculum-committee.
A listing of future curriculum visions articulated by faculty members in each discipline was developed. Student services and administrative colleagues were also asked to identify their future visions for service delivery and student support. The future curriculum and service delivery visions were based upon responses to a questionnaire, interviews and listening sessions, open house events, and inspection of recent comprehensive program review documents The ideas were divided into two groups: (1) those for which some curriculum or administrative work had been started, recently approved, or lately modified and (2) those for which the idea was still percolating with an undetermined action/implementation date. These visions helped to spot interests in potential additional facilities and to recognize aspects of the current facilities that were not working well for the programs and services. Faculty members, student services professionals, administrative support specialists, and deans were also asked to identify their future interests in technology. The lists and discussions below summarize those visions of a potential future and perceptions about facilities and technology.
Academic Affairs Career and Technical Education Team Visions
Business, Commerce, and Public Safety Instructional Group
Curriculum Started, Recently Approved or Modified
Faculty members in accounting, business, computer science, economics, management, and marketing are working to offer some additional online classes through the State Online Education Initiative (OEI) course exchange program.
The business faculty group updated the certificate and degree in retail management that had been created for the Western Association of Food Chains (WAFC). The program is delivered via distance education.
The cosmetology program revised its esthetician certificate of proficiency in 2015.
Faculty members in the digital media program recently refocused the curriculum to ensure transferability to CSU Monterey Bay and alignment with offerings at Hartnell College.
The computer science faculty members participated in a cooperative Title V grant with CSU Monterey Bay to further align curriculum in that discipline with a goal of increasing the numbers of transfer students.
Four courses for a hospitality certificate program are being developed with a focus on entry-level server and management roles plus sanitation.
In 2015 the public safety faculty group established two certificates of achievement- Law Enforcement Option 2 and Fire Science. The intent was to grant credit to those students who completed either the basic police or fire fighter I academy.
Ideas Percolating, Undetermined Implementation Date
The AD-Ts are expected to help grow enrollments in those disciplines.
Business faculty members anticipate the expanded use of electronic media and more emphasis on international trade and commerce.
Computer science and digital media faculty members at Gavilan College and local transfer institutions are exploring ways to incorporate industry- driven changes.
Computer science faculty members are contemplating developing stackable awards such as:
Programmer
Front-end web developer
Linux certification
Full-stack developer
Computer science faculty members are also considering adding a robotics class and certificate program.
Cosmetology faculty members would like to expand enrollments in their program.
College leadership is exploring the possibility of a paramedic program.
Perceptions About Facilities
The business faculty groups identified a need for additional daytime lecture rooms at the main campus. There is a particular need for an additional lecture room for the administration of justice students.
Cosmetology has limited space for instruction and cannot accommodate the number of students who would like to enter the training.
The South Bay Regional Public Safety Academy, for which Gavilan is a consortium member, began instruction at the Coyote Satellite Center in January 2017.
Perceptions About Technology
Economics faculty members are contemplating needed computer hardware and software upgrades, particularly to support distance education.
Business faculty members identified a need to create a calculator loan program for students taking the statistics for business and economics course.
Additional distance education staff support is needed.
Cosmetology is using more media tools to show various practical applications of hair styling.
Health and Education Instructional Group
Curriculum Started, Recently Approved or Modified
Child development faculty members are updating all certificate programs to align with the State permit and credentials requirements. Federal and now California standards require an Associate Degree for teacher assistants and a Bachelor’s Degree for early childhood teachers.
A pathway is being created for transitional kindergarten teachers.
A strong lab program is being developed for the child development and educational studies curriculum.
The Liberal Arts Elementary Education AD-T is being moved through the campus curriculum process.
The allied health program faculty members created certificates for home health aide and nursing assistant in 2015 and recently have adjusted some of the prerequisites for the licensed vocational nursing ladder option.
Nursing faculty members are implementing improvements to the new skills laboratory in the CD building.
A transition pathway to a Bachelor of Science in Nursing has been created with CSU Monterey Bay.
A pilot effort is being conducted with community education to offer fee- based courses in medical Spanish and phlebotomy.
Ideas Percolating, Undetermined Implementation Date
Child development faculty members have offered online courses in the core curriculum and are considering offering online courses in other parts of the program.
Into the more distant future the child development faculty team anticipates the need for pathways to assist those who want to become middle and high school educators. They also recognize a need for training prospective teachers in the use of more electronic devices and to strengthen existing curriculum for those who will be working with specialized needs children and families in diverse communities. Future curriculum may need to be developed around topics such as the k-12 common core standards, brain development, and language development.
College leadership is exploring the possibility of a paramedic program.
Perceptions About Facilities
The child development faculty members have identified a need for a demonstration lab facility with indoor and outdoor areas for the observation assignments in the program and the required practicum classes. The small number of off-campus sites that meet Title V standards currently limits enrollment. The practicum laboratory classes are required for graduation and to qualify for State permits. Some students leave the program for study elsewhere because they cannot easily complete the required practicum. The following space needs have been identified:
Workspace for students, faculty, and community programs.
A meeting room area for community agencies and faculty members.
Access to a kitchen facility would support the health and nutrition education curriculum.
Storage space for teaching aids and materials.
The paucity of off-campus clinical facilities, no additional campus instructional space, and the lack of additional faculty constrain enrollments in the registered nursing program.
Industrial Technology Instructional Group
Curriculum Started, Recently Approved or Modified
Aviation maintenance faculty members are actively recruiting students to help grow program enrollment.
The Federal Aviation Administration has proposed a redefinition of the educational requirements for industry certification. There will be more focus on electronics and removal of very old technologies such as wood construction, fabric covering, and radial engines. The program faculty members have already adjusted the curriculum. Additional instructional time is devoted to:
Electronic engine controls
Turbine engines
Advanced electronic avionics
The College is activity developing four core courses for a certificate in unmanned aerial systems (UAS or drone technology) that will be taught at the Coyote Satellite Center.
The College leadership is actively involved with the regional CTE deans and faculty expertise at San Jose City College in developing a residential Heating, Ventilation, and Air Conditioning (HVAC) program of study that will occupy the MP building on the main campus.
The water resources management faculty members have disaggregated the existing curriculum and added new courses to establish four areas of concentration, each with a degree and a certificate of achievement.
Water Distribution Technology Education
Water Technology Education
Wastewater Collection Education
Wastewater Technology Education
Perceptions About Facilities
The aviation program began instruction at its new San Martin airport facility in fall 2016.
Significant renovations will be required to the MP building before it can be used for HVAC instruction.
Perceptions About Technology
Aviation is expanding the number of course resources it makes available online.
Academic Affairs Kinesiology and Athletics Team Visions
Kinesiology and Athletics Instructional Group
Curriculum Started, Recently Approved or Modified
In 2015 the faculty members implemented an associate degree in kinesiology with four areas of emphasis:
Education
Sports Management
Sports Medicine
Personal Training/Fitness
Ideas Percolating, Undetermined Implementation Date
Department faculty members are exploring the possibilities of online or hybrid offerings to increase enrollments.
Faculty members would like to
Increase the sports offerings.
Restructure program outcomes to be more current and specific.
Incorporate a health, recreation and leisure, and dance component into the department.
Explore more collaboration with math, English, and tutoring services to promote a more successful learning environment.
Faculty members are always on the look out for the latest trends of interest in the field. Consideration is being given to the feasibility of certificates in these areas as examples of current interest areas:
Pilates
Coaching
Yoga
Cross-training fitness
When the reconfigures and expanded pool is available it will create opportunities for a women’s water polo course and other water-based courses. It will also allow the Disabilities Resource Center
The College is exploring an administrative reorganization that might bring health instruction to the physical education area and open new curriculum possibilities for the instructional group.
Perceptions About Facilities
The range and number of courses offered by the department are limited by facilities. The department does not have a pre-assigned lecture classroom.
The swimming pool will be reconfigured and expanded in spring-summer 2017 for use in fall 2017.
More classroom, fitness, storage, locker room, athletic training, gym, and office space is needed.
A multi-purpose field would be very helpful to support increased enrollments and Athletics.
To expand enrollments further the department would need an auxiliary gymnasium.
Academic Affairs Liberal Arts and Sciences Team Visions
Fine Arts Instructional Group
Curriculum Started, Recently Approved or Modified
A medical Spanish course is being piloted through community education to meet student needs in the health programs. If it is successful, the course may be brought into the regular credit Spanish offerings.
An AD-T in history and an associate degree in studio art were established in 2015.
A fast track presentation (five week delivery) for communication studies courses in a certificate is being offered to target both working and off site students.
New courses are being written for the Theatre Arts Program in Improvisation and Latino Theory/Theatre.
Ideas Percolating, Undetermined Implementation Date
Fine arts faculty members are considering expanding the studio arts offerings with photography, three-dimensional design, and sculpture. The expansion might include 3D design, sculpting with different materials and processes (metals, fiber), and 3D printing.
Art history needs more curriculum developed e.g., Art of Asia, Oceania Art, History of Photography.
The gallery will need to be aligned to the two art programs (studio and history), and perhaps a more comprehensive gallery management program could be developed.
Fine arts faculty members are exploring the idea of including some arts courses into the science, technology, engineering, and math (STEM) program.
Faculty members in this group would like to expand photography offerings with a focus on art and digital photography.
The journalism curriculum needs at least one additional course to retain its transfer status. There is an opportunity for journalism faculty members to work with the film/TV or communications faculty members for that new course, perhaps focused on public relations. Alternatively, there may be an opportunity to incorporate journalism into the film/TV program. Film/TV program faculty members are thinking about expanding offerings in editing, cinematography, sound, acting, etc.
Spanish faculty members are considering a new translation course and exploring the possibility of a certificate for translation.
An internship program for journalism and film studies students would be a helpful addition. Additional offerings in Japanese culture, literature, etc. would strengthen that language program.
Perceptions About Facilities
There are several important renovations to the music building that were not addressed in the Measure E effort. Practice rooms are in the theater building and are not well soundproofed thus when used they disrupt theater instruction.
The art programs need additional space, outdoor work areas, offices and meeting rooms.
Communications faculty members would like to see more instructional space that is connected (side by side) and additional storage for instructional materials.
It is difficult to find classroom space during prime instructional periods. It would be helpful if the spaces were equipped with smart technology and mobile furniture that could accommodate small group discussions.
The Theatre Arts complex was not included in the last bond, Measure E. Several repairs and updates that are needed: (1) all roofs have major damage for both the main building and the two auxiliary shops (Theatre 127 & 130/1), (2) the public seating needs refurbishing, the carpets need replacing, and the outside lights in public areas are inadequate, (3) there is no designated instructional space except the theatre and stage (as class offerings expand this will become an issue for the program), (4) there is no meeting space or offices for the student club or adjunct faculty members, and (5) the lighting equipment for use onstage is outdated and needs to be brought into line with industry standards. Most importantly, the outside working area of the scene shop has an unsafe deck area that needs to be replaced (outside Theatre 127).
Perceptions About Technology
The Japanese program would benefit from investment in technology, including online tutoring, self-study, Quizlet, etc.
Language Arts Instructional Group*
Curriculum Started, Recently Approved or Modified
English department faculty members have designed basic skills composition courses for acceleration where students can self-place at one
level below transfer (ENGL 250 and 260). Supplemental instruction support is also being provided. A retention specialist has been added and a full-time counseling position has been established and filled.
The English department is committed to using a formal high school GPA as part of the multiple measures to place students directly into ENGL 1A.
Efforts in English composition to integrate reading and writing have been launched for one level below transfer (ENGL 250P and 260P) curriculum.
English faculty members are in discussions with local high schools to further align the curriculum, communicate expectations, and discuss college readiness standards.
The Writing Center staff members have been investigating online asynchronous and synchronous tools and practices for working with writers, but more training will be required. The overall goal is to develop the student’s writing ability over time, not just to improve a single essay.
The ESL program implemented an intermediate level certificate of proficiency composed of credit classes in 2015.
ESL faculty members have been working with the noncredit program leadership and faculty to create contextualized ESL courses to support career and technical education and ESL curriculum that can be dual-listed, credit and noncredit (zero units, no enrollment fees) courses taught simultaneously.
Ideas Percolating, Undetermined Implementation Date
Multiple measures and acceleration efforts are expected to bring higher levels of student success but will also increase the use of Writing Center services and the need for supplemental instruction leaders and tutors.
English faculty members are anticipating additional professional development around integrated reading and writing pedagogy and its expanded implementation to more sections.
The adoption of Canvas as a learning management tool means that professional development will be needed to develop best use practices among the faculty members teaching online classes.
*For noncredit ESL visions see the Noncredit and Community Education Instructional Group vision list.
Perceptions About Facilities
The noise levels in the Writing Center make it difficult to conduct a writing lab. The Center space is too small and serves multiple functions. The face-to-face support offered by the Writing Center and supplemental instruction needs to be increased at the satellite locations.
Current pedagogy (integrated reading and writing) requires classrooms with mobile seats and tables.
The classroom spaces allocated to the ESL program are too small to hold the numbers of enrolled students and those who would like to enroll. The rooms are not well configured for language instruction.
Perceptions About Technology
There is a need to upgrade technology, e.g., document cameras at the satellite centers.
There is a need for professional development on the best practices in the use of the Canvas learning management system software. Smart technology is needed for all classrooms where English is taught.
English faculty members would like the College to re-establish an early alert software system, particularly for use in basic skills courses.
Natural Sciences and Math Instructional Group
Curriculum Started, Recently Approved or Modified
Math faculty members are developing an accelerated version of the MATH 8A and 8B curriculum and offering additional sections of MATH 5, Elementary Statistics, online.
A pilot effort at two high schools is being conducted to offer the math boot camp curriculum format to help high school students brush up on key math concepts. Discussions are underway to train high school faculty to teach the boot camp curriculum.
The very popular BIO 10 course was offered as a hybrid in summer 2016 and will be offered in fall 2017 as a hybrid or fully online.
Ideas Percolating, Undetermined Implementation Date
The faculty members would like to see an engineering transfer program re-established, as it would position successful students to transfer and eventually help to meet labor market needs. Students appear to be most interested in mechanical and computer engineering specializations. If healthy program enrollments could be developed, they would increase enrollments in core courses from most of the science and math disciplines due to the prerequisite engineering course requirements.
The math faculty group would like to offer additional sections in the accelerated format. However, adjunct faculty will need professional development for that purpose.
Consideration is being given to offering hybrid math courses in the future.
Math faculty members are considering converting the arithmetic course from credit to a noncredit offering.
Biology faculty members are exploring the possibility of offering some environmental science courses.
Perceptions About Facilities
Faculty members have been planning to renovate a room to serve as a STEM center. The STEM center would provide tutoring, supplemental instruction, counseling, and small
workshops. The ideal center would have group study rooms, a tutoring area, computers, and offer a book loan program to support student success.
While there is demand for biology instruction, there are insufficient laboratory facilities.
Chemistry classes fill before the registration period concludes, but the discipline is short on laboratory space.
Classroom space is at a premium for accelerated math classes that are scheduled to use a room for ten hours a week. The faculty members would like to offer more sections in this accelerated format.
Perceptions About Technology
The faculty members expressed an interest in the College establishing a computerized waiting list system.
Social Sciences Instructional Group
Curriculum Started, Recently Approved or Modified
Social science faculty members are expanding coursework as appropriate to develop existing majors.
Starting in 2014 all course updates have been used to qualify the course for a C-ID code.
Social science faculty members have engaged in professional development experiences in an effort to increase student success in online classes. Recent data indicates those efforts have increased retention and success.
With support from the Title V HSI grant faculty members have been developing problem-based learning assignments and service learning partnerships to bolster civic engagement.
The global studies degree has been deactivated.
Ideas Percolating, Undetermined Implementation Date
Social science faculty members are considering additional AD-Ts in social justice, sociology, and social work when that TMC is finalized. Most of the required courses are already established and only a few new courses will need to be created. The social justice AD-T would replace the current community studies degree.
There is interest in a possible program of study in a lesbian, gay, bisexual, transgender, and queer (LGBTQ) program of study.
Perceptions About Facilities
Classrooms with mobile seats and tables would be helpful to support current pedagogies (flipped classroom, directed learning assignments, problem-based learning, research labs, reading apprenticeship techniques, scaffold research projects, habits of mind framework, etc.) that seek to use more group work and student active learning during class periods.
Perceptions About Technology
Smart technology in the classrooms would be helpful. An upgrade to existing technology is needed.
Academic Affairs Library and Distance Education Team Visions
Library and Distance Education Instruction
Curriculum or Services Started, Recently Approved or Modified
In February 2016 the Accrediting Commission for Community and Junior Colleges approved a substantive change proposal authorizing the College to offer 41 degrees and 38 certificates where fifty percent or more of the curriculum was delivered via distance education or electronic means.
The College is in the process of revising the Distance Education Program Plan first written in 2013.
The part-time instructional technologist is an OEI trained course evaluator. She is helping faculty improve the quality of the course designs and pedagogy used in online courses. The College hopes to hire a full-time person as an instructional technologist.
The communications department is working with the distance education coordinator to deliver courses in hybrid and in an online format. The work is based on the successful experiences with math and Spanish faculty members.
The library staff members are in the middle of efforts to integrate more fully academic support, classroom instruction and student services support.
Ideas Percolating, Undetermined Implementation Date
Library faculty members plan to expand its instructional presence by
Increasing offerings of information literacy courses.
Strengthening collaborations with classroom instructions and embedding librarians in research-related courses such as English 1A.
Regular and systematic presence in the online learning platform.
Integrating information literacy instruction into tutor training.
Expanding, revising and reinventing the library’s online presence.
Distance education program leadership plans to use the Title V grant to
Increase online presence, even in face-to-face classes.
Increase the numbers of online courses to meet student demand.
Provide more professional development to faculty according to the state online education initiative (OEI) standards.
The distance education program coordinator is exploring the use of videoconferencing technologies and hybrid formats to deliver synchronous instruction for previously hard-to-deliver, in-demand general education classes such as lab sciences to the satellite centers in Hollister, Morgan Hill, and Coyote Valley.
Perceptions About Facilities
The library building serves as a hub for innovative teaching and learning with the library staff, tutoring services, learning commons, writing center, and teaching and learning center physically together. However, the building is the oldest un-renovated building on campus and needs to be remodeled to reflect its role as a learning resource center and to present an image of relevancy and currency. Space for collaborative learning, study rooms, multi-media creating spaces as well as additional office space are needed. The satellite centers in Coyote Valley, Morgan Hill, and Hollister need library support services and space.
Perceptions About Technology
The library’s building infrastructure needs significant upgrades in wired and wireless connectivity and electrical power capacity. Also needed is server space to support a robust civic engagement archive and multi-media student work.
The distance education program is making use of the campus wireless support update and expansion. The Canvas learning management system is being implemented.
Videoconferencing technology is being evaluated for the Hollister satellite center at this time. As with any technology, the College will need to plan for upgrades and expansion in the future to support the efforts to expand distance education offerings.
Academic Affairs Noncredit and Community Education Team Visions
Noncredit and Community Education Instructional Group*
Curriculum Started, Recently Approved or Modified
A GED Preparation certificate was approved in 2015.
ESL faculty members implemented a Lifeskills and vocational ESL certificate in 2015. These are intended as a part of the regional Adult Career and Education Services (ACES) block grant consortium plan.
A series of ESL occupational classes have been created to contextualize language learning with the occupational skills. These include: keyboard basics, computer/internet basics, presentation basics, website design basics; excel basics, word processing basics, business (entrepreneur) basics. These are intended as a part of the regional Adult Career and Education Services (ACES) block grant consortium plan.
ESL faculty members have developed a way to simultaneously teach credit and noncredit courses with the same content.
A full-time noncredit program counselor has been hired
Community education is offering fee-based courses in medical Spanish and another in phlebotomy as a pilot that might be converted to regular credit classes.
Ideas Percolating, Undetermined Implementation Date
In the near future the noncredit program leadership and faculty members plan to create additional career and technical education programs that partner with credit instruction in areas such as welding and hospitality.
The leadership plans to explore seamless connections with county social service programs and workforce investment boards.
Noncredit program leadership plans to explore opportunities with work- placed ESL and Older Adult courses.
More accelerated options in ESL are being explored.
More noncredit basic skills courses are being explored.
The noncredit program leadership would like to explore ways to develop more workforce development efforts in collaboration with local businesses.
The noncredit program leadership is exploring ways to provide workforce education to those incarcerated in the San Benito County jail. This would be part of a transition back to society effort for those who will be released.
The community education program leadership anticipates
continuing to develop courses to meet community needs that can be converted to credit or noncredit offerings, if successful.
Developing short courses in both hard and soft skill topics that will be essential for a workforce that is composed of independent contractors more than employees of a firm.
*For credit ESL visions see the Language Arts Instructional Group vision list.
Perceptions About Facilities
Additional instructional space is needed at both of the satellite centers (Morgan Hill and Hollister) in order to offer a full complement of classes.
Community education identified a need for a dedicated facility to support larger programs like vet tech, phlebotomy, pharmacy tech, welding and advanced manufacturing instruction as well as a kitchen that could support cooking classes. It is particularly problematic for the program where there is specialized equipment and unique waste disposal needs associated with the instruction.
In order to effectively meet with local business, faculty members and staff the community education director needs a confidential meeting space area because the director’s office is too small. There are meetings with these groups several times a week.
Perceptions About Technology
Instructors are increasing the use of technology in their teaching practices, but there are limitations at the satellite centers and community facilities.
Updated technology and effective Internet service was identified as essential to the contract and community education program.
Student Services Team Visions
Student Services Instructional Group
Curriculum Started, Recently Approved or Modified
In 2015 the guidance faculty members implemented a peer education leadership certificate.
Categorical funding from the Student Success and Support Program (3SP) provided the resources for Counseling Department faculty members to start a First Year seminar course that provides orientation to college instruction. The course is provided both online and face-to-face over a five-week period at all campus locations, various days and locations, and on Saturdays..
The Universal Access (formerly Section 508) Task Force is currently the driving force for access to all District programs and services for students with disabilities. The DRC faculty members assist the Gavilan faculty in applying for the Distance Education and Captioning Transcription (DECT) grant to ensure the development of accessible training materials for online courses.
Tailor the GUID 210, First Year College Student Seminar, course to specific student populations (foster youth, EOPS, CTE, STEM, etc.) to address their specific interests and needs. Similar to the adaptation of GUID 260 for DRC students and KIN 1 for athletes that meet the college orientation requirement.
A boots to books course is being developed for veterans who enroll at the College. It will include the content of the GUID 210 course.
Ideas Percolating, Undetermined Implementation Date
The Counseling Department faculty members would like to
Expand the number of GUID 1, Self Assessment and Career Development, classes and tailor the course content for specific populations (recent high school graduates, returning/reentry students, displaced workers, etc.) to reduce the numbers of students who are undecided/undeclared in their program of study and promote more completions.
Increase the numbers of sections offered for GUID 27, Contemporary Leadership, and GUID 52, Peer Mentoring, Education, and Leadership, to strengthen student leadership and peer mentoring education.
Co-locate all counselors to one building and develop a case management approach to working with students.
The DRC faculty members would like to
Develop better pathways for incoming students to meet their educational needs.
Participate with other departments as they consider changes to existing basic skills, adult education, non-credit, and community education curriculum.
Find ways to share their resources (keeping within the categorical grant guidelines) with other units at the College.
Add more educational assistance courses at the off-site locations.
After construction to the pool facility is completed (start of fall 2017), the DRC faculty members will restructure the Adapted Physical Education program to include aquatic fitness courses again.
Perceptions About Facilities
Counseling Department faculty members believe that all counselors should be co-located in one common area with some private office spaces and adjacent to other front-line student services offices. A meeting room equipped with a smart board and technology connectivity would be helpful.
The DRC test-proctoring center (LI 132) is not large enough to meet the needs of students in the disability resource program. Also, some private office space for confidential conversations and student learning disability evaluation needs to be provided.
Student Services Unit and Department Group
Curriculum or Services Started, Recently Approved or Modified
All of the units in Student Services are focused upon implementing existing initiatives that will need to be evaluated for effectiveness and modified as needed.
Temporary swing space has prompted the Financial Aid staff members to focus on essentials.
The Disability Resource Center (DRC) is expanding services to the three off-site locations.
The Veteran’s Resource Center (VRC) is creating a one-stop location for services, adding a book loan program, incorporating orientations and specialized courses, and responding to additional mandates required by potential grant funding.
The Morgan Hill site staff has picked up outreach and community events responsibilities to help promote the Educational Center.
Financial Aid staff members are seeking to exploit technology to communicate better with students and to use packages such as EAB Navigate, Grad Guru, Ellucian student information system, Campus Logic, and Academic Works to help them succeed.
Ideas Percolating, Undetermined Implementation Date
The Hollister Center staff members intend to work on optimizing enrollments, course offerings, and services to reflect community needs and growth.
Admissions and Records staff members are seeking alternative methods of communication with students and improved technology to provide faster service and greater accuracy.
The Counseling staff members will be implementing Grad Guru, Education Advisory Board (EAB) Navigate and other applications online in the next several years.
The EOPS/CalWORKS program staff members anticipate using more peer-to-peer support and mentorship opportunities in the future. These efforts are thought to be particularly helpful to subgroups such as foster youth and undocumented students. The unit intends to work on increasing student engagement/community building to increase persistence, completion, and transfer rates.
Going paperless is of interest to the EOPS/CalWORKS staff members.
The CalWORKS unit would like to expand the food pantry, make Fresh Success a permanent, new categorical program, and advocate for extending the time students can participate in the program. Fresh Success is a pilot program from the Chancellor’s Office that targets students on food stamps and works to support them, like EOPS and CalWORKS.
The DRC staff members are exploring Clockwork software.
Perceptions About Facilities
With its topographical grading pattern the main campus property presents some challenges for physically disabled students to traverse among the buildings. Within some buildings there are challenges to students with disabilities as well.
The current office spaces for the student services units are old, fragmented, and not efficient. Counseling, Admissions, Financial Aid, Student Health Services, Welcome Center, Associated Students, and the Vice President for Student Services anticipate being in a remodeled facility where services can be more contiguous or a “one-stop” area can be created.
CalWORKS staff members believe they need additional space with areas in which to hold confidential discussions, areas to store perishable food items, and storage for a textbook lending library. EOPS/CalWORKS unit leadership identified a need for an “easy to find” facility that could house all of the staff together to promote collaboration, open communication, and a welcoming atmosphere. The anticipated space needs include five private offices, four cubicle spaces, front desk reception, student study/workshop space, small computer lab with ten computers, meeting space, and a waiting area.
Additional space for staff is a need identified by the Financial Aid office group.
The Hollister Center would like to create smart classrooms for a better educational experience. The Center is also in need of science laboratory spaces. Additional space for quiet study rooms, a tutoring area, and a meeting room would be very helpful.
Admissions and Records unit members are seeking additional space to accommodate the additional staff associated with increased enrollments. The unit is also requesting meeting room space.
The DRC needs additional quieter space with a computer and Internet connections for test proctoring. At each off-site location office space a testing area and a space with computer stations for assistive technology access will be needed.
VRC staff members anticipate the need for additional office space, a meeting room, and storage areas to serve students in a one-stop location. If the College changed its data storage strategy to using cloud technology, the computer server room adjacent to the VRC could be repurposed for the Center to use.
The Counseling faculty members need some private offices to ensure confidential counseling services with students. A centralized, dedicated counseling center to support general, categorical programs, and mental health services with space for support staff and a meeting room would be ideal.
The current facility at Morgan Hill has suffered from significant infrastructure systems failures (plumbing and HVAC) and the appearance is not optimal due to basic painting work needs. It would be very helpful to have a lounge and workspace for faculty to prepare materials and meet with students, a quiet space for students to study, and some better office space for the staff.
The TRiO and MESA programs leadership needs additional student study and tutoring space in order to meet grant expectations.
Perceptions About Technology
On the whole, most offices are interested in transitioning to paperless processes.
While students at the College are issued an email account, it is believed that they do not make great use of that account.
Due to state mandates, such as SSSP, student use of technology and supportive software has become more prevalent.
The CalWORKS staff members would like a user-friendly way to get data about the students in their program.
The Admissions and Records staff members would like management information service support to trouble shoot and provide upgrades/customizations and solutions to student information system needs.
Administrative Services Team Visions
General Administrative Offices Visions
Initiatives Started, Recently Approved or Modified
As the Coyote Valley site comes online in spring 2017 more communications support (staff and budget to outreach to that area) in the Public Information Office (PIO) will be required. The PIO staff is conducting a survey of students to determine their media preferences.
In spring 2017 the human resources/business module of the Banner enterprise resource planning software will be implemented. This will open
the door for more self-service by employees. Payroll for employees and student workers will be prepared on campus rather than at county offices.
The Purchasing Office implemented electronic requisitions one year ago.
In general the College has been implementing more web-based services in recent years.
The Information Technology (IT) staff members have implemented a virtual infrastructure for all servers. The staff is also training staff in key offices to use imaging software in an effort to reduce the extent of paper- dependent processes.
The College has implemented several software products to increase student access and promote greater success. Among those packages are the following.
NetTutor to provide tutoring services to distance education students.
DegreeWorks for educational plans.
Accuplacer for academic assessment and course placement
SARS for counseling services.
GEARS for early alert to students who have difficulty with a course.
Canvas learning management system will be implemented in 2017- 2018
Ideas Percolating, Undetermined Implementation Date
Additional staff members are needed in Facilities Services to support the new facilities at Coyote Valley and San Martin Airport as well as the aging facilities at the main campus.
The Office of Institutional Research would like to move toward a more systematic, prospective approach to support decision making at the College vs. an ad-hoc, retrospective research request operation alone.
The Business Office anticipates further integration and automation of business processes to provide higher levels of service to the campus.
The Information Technology (IT) staff members are exploring the feasibility of a virtual desktop infrastructure (VDI) that would allow students to using their personal devices to log into the College virtual environment and access College software resources.
Perceptions About Facilities
The PIO needs an office with room for three workspaces, a small meeting table, and storage for marketing and other materials.
Facilities Services believes there is a need to upgrade the HVAC systems, classroom fixtures, and power systems at the main campus.
The Vice President for Administrative Services, Human Resources, and Business Services units look forward to having a meeting room for interviews and staff group discussions in a permanent building with proper technology and from which to offer
services. Currently, there are three different locations for business services on campus. That presents some logistical problems and employee supervision issues.
The Office of Institutional Research anticipates needing additional office space for staff and a meeting area.
The College will begin to operate from the expanded Coyote Valley facilities in spring 2017 and anticipates expanding operations in Hollister with the future development of an 80-acre parcel at Fairview Corners.
Perceptions About Technology
Social media, applications, text messaging, and blogs have impacted the communications strategies used by the PIO and by students. Some of the changes in technology make it harder for many students to navigate and access information and harder for staff to select among the multiple channels to reach students. A digital signage system with screens would be helpful at all College locations.
Human Resources leadership anticipates needing additional technology in the future so that applications for employment can be submitted online.
The College is in the process of upgrading the IT infrastructure to increase network bandwidth connections to the Internet. Core network equipment is being upgraded to ensure that all areas of the campus are well served. Minimum technology standards for classrooms and laboratories have been created and included in the Facilities Master Plan. The Coyote Valley site has been identified as the off-campus IT disaster recovery site and equipment has been purchased to provide a viable technology backup solution for the main campus.
General Areas of Opportunity
Several general areas of opportunity are available to the College at this point in time (academic year 2016-17). In most cases the College has already acted upon these opportunities. The suggestions that follow are offered in support of the College mission, vision, and values previously cited in this Plan.
Senate Bills 1440/440
The 2010 enactment of the Student Transfer Achievement Reform (STAR) Act, aka SB 1440, provides the California community colleges with an opportunity to tailor requirements in some of the established transfer-oriented programs that had been offered and to introduce new ones. Three additional model curricula have been created to promote a greater degree of standardization for community college associate degrees where the discipline does not fit the 60 lower-division units plus 60 upper-division units structure of the STAR Act. These are not TMCs within the SB1440/440 framework.
They are in the fields of: (1) Engineering; (2) Information Technology; and, (3) Nursing.43
As of spring 2017, thirty-six model curriculums had been approved that cover the CSU majors selected by roughly 80 percent of the community college transfer students.
Gavilan faculty members have moved aggressively to establish 22 AD-Ts and have two additional ones (Elementary Teacher Education and Biology) under development.
Completed questionnaires and faculty interviews indicate an interest in expanding the number of transfer degrees offered. Each AD-T brings an obligation to offer the required courses over a two-year period.
An analysis of course offerings over the last three years indicated that some required courses did not attract sufficient numbers of students to be retained or were not scheduled. Sponsoring so many AD-Ts will require careful enrollment management and scheduling efforts, and some programs of study may not be sustainable.
Assembly Bill 86- Assembly Bill 104 Block Grant
The Legislature provided the community college system with an opportunity to serve new students and advance the interests of the State. The May 2016 revision of the Governor’s proposed 2016-17 budget includes a $5 million increase for statewide activities to support the Adult Education Block Grant program that provides funds to school districts and community colleges. The Superintendent of Instruction and the Chancellor of the community college system developed a plan using the consortia structure in future years to distribute Workforce Innovation and Opportunity Act (WIOA), federal Title II, and Perkins funding.
The goals and activities of the ACES consortium are described in the Institutional Effectiveness chapter of this Plan and in the related Appendix Grant-Funded Intervention Summaries.
The College may want to consider expanding its support of workforce education to those incarcerated in the San Benito County jail and other high- need populations. Those efforts would dovetail with the changed state policy regarding the importance of providing occupational education to the soon to be released individuals in an effort to reduce recidivism. SB 1391 (2014) revised administrative regulations to make such collaborations more attractive to community colleges.
California Online Education Initiative (OEI)
The third general opportunity is the OEI project launched in 2013 that seeks to re- invigorate online instruction within the California community college system by addressing some of the known shortcomings in distance learning. The Initiative has the Governor’s backing and a $56.9 million budget over 55 months. With the grant funding, the OEI provides colleges with incentives to participate actively. Future students are
![]()
43 For additional information see https://c-id.net/degreereview.html
promised online learning readiness materials, tutoring and basic skills support, counseling/advising, and streamlined access. OEI offers no-cost or low-cost tools such as a course management system, course design resources, a re-designed California Virtual Campus website and catalog, and professional development for faculty. OEI also offers faculty resources for curriculum design, professional development in teaching in the online environment, peer review feedback of instructional design and pedagogy ideas, resources to help work with the course management system, example policies for effective practices, and proctoring assistance.
One of the most promising aspects of the OEI is the Exchange. It is often challenging for colleges to ensure that all students have access to the courses they need at the times that best fit their busy schedules. The goal of the Exchange is to facilitate progress toward completion by providing access to courses across colleges. Students enrolled at colleges in the Exchange will be able to seamlessly register for Exchange courses, often those in high-demand or difficult-to-fill courses. To ensure that course credits are recognized by a student’s home college, all participating colleges will become members of the OEI Consortium. Membership will require the college to change business processes to make registration seamless, host technology-based mechanisms to carry out those processes, sponsor courses designed to a set of exemplary online education standards, recruit faculty who are committed to excellence in online learning and teaching strategies, and offer courses students need to complete their educational goals. The vision for the Exchange has been dubbed the “Herculean” task of the OEI as it may be the most complex work undertaken in the overall effort, but it portends great dividends for the students.
Over the years a great deal has been learned about the challenges to effective learning through an online environment. The OEI appears to be offering solutions to those known challenges.44 The course credit exchange component of OEI may be a way to help the College attract even larger numbers of students to its offerings. College faculty members and administration have seized the OEI opportunity in adopting Canvas, the state- recommended course management system, and have educated leaders and staff in the best practices and principles of online course design and pedagogy. The College also has a program in place to provide professional development to small cohorts of faculty as described earlier in this Plan.
Until additional instructional facilities can be constructed to address student enrollment demand, offering more courses through online education is a short-term means to address those needs. In the longer run, distance education is a growing popular means of learning. The College has able leadership and resources to help faculty hone skills to teach in the demanding online instructional environment and to improve student success in the growing number of online classes being offered. Some additional technology support may be needed in the future.
The College has a long tradition of online offerings and is therefore encouraged to continue promoting this opportunity and may want to start
![]()
44 Hans Johnson. et. al. Successful Online Courses in California’s Community Colleges. Public Policy Institute of California. June 2015
planning for the expansion of the distance education program in the next one to three years.
The College is actively considering using some form of two-way interactive video and audio technology to provide additional instruction to residents in Hollister.
That exploration is encouraged. The College may want to consider the possibility of collaborating with public school districts to use some form of teleconferencing as a means to deliver college-level instruction to dually enrolled high school students.
Acceleration Designs for Instruction and Course Placement
The instructional strategy known as acceleration has taken on multiple forms among community colleges throughout the nation. In part, accelerated courses arose because the well-intended established designs of basic skills curriculum sequences often create unintended consequences. Traditional multiple exit points lead many students to get discouraged and to leave college.45 Large-scale research studies outside and within California have demonstrated that when a student needs to complete more levels of developmental courses the student is less likely to ever complete college-level courses in English and math.46
Other reasons for the increasing popularity of acceleration strategies emerged from national research that raises questions about the efficacy of making placement decisions based primarily upon the results from a single examination experience.47 Still other national research pointed to the reliability of high school transcript data to predict success in college.48 Acceleration has been found to work for students of all backgrounds and at all placement levels, but implementation strategies do impact the final results.49 These research efforts open a “new door” for acceleration initiatives. The general concept of acceleration has even been discussed as part of the Adult Education Regional Consortium initiative.
![]()
45 Juan Calcagno and Bridget Long. The Impact of Postsecondary Remediation Using a Regression Discontinuity Approach. National Center for Postsecondary Research, April 2008; Thomas Bailey, Dong Jeong, Sung-Woo Cho. Referral, Enrollment, and Completion in Developmental Education Sequences in Community Colleges. Community College Research Center, Teachers College, Columbia University.
Working Paper # 15, 2009.
46 Nikki Edgecombe. Accelerating the Achievement of Developmental Education Students. Community College Research Center, Teacher’s College Columbia University. Working Paper #30, 2011; Peter Bahr, et. al. Course-Taking Patterns, Policies, and Practices in Developmental Education in the California Community Colleges. Ed Source. June 2010.
47 Judith Scott-Clayton. Do High Stakes Placement Exams Predict College Success? Community College Research Center, Teacher’s College Columbia University. Working Paper #41, 2012; Olga Rodriguez, et. al. Remedial Placement Testing in Community Colleges. Community College Research Center, Teachers College, Columbia University. Working Paper # 73, 2014.
48 Clive Belfield and Peter Crosta. Predicting Success in College: The Importance of Placement Tests and High School Transcripts. Community College Research Center, Teachers College, Columbia University. Working Paper #42, 2012.
49 Craig Hayward and Terrence Willett. Curricular Redesign and Gatekeeper Completion: A Multi-College Evaluation of the California Acceleration Project. April 2014
The term “acceleration” has been given various definitions, or different labels, or descriptors. For purposes of this discussion four definitions/strategies have been identified as follows:
Changing placement policies by adjusting placement exam cut scores and using more robust multiple measures data.
Implementing co-requisite models.
Compressing the pace of instruction as a strategy is perhaps inspired by the experience of faculty who teach a summer session of the same course they offer during the fall or spring term. Course retention and success are thought to be higher during the summer session experience. But, is that because students attending during the summer are better prepared and more motivated, or are the results due to the shorter period of time and the more intense instruction and contact with the subject matter? This scheduling strategy during a primary term arranges two levels of remedial curriculum in the discipline so that one course in the sequence follows the other, each using half of the weeks in the primary term. Typically the sequenced courses are taught on the same day and hour pattern with the same instructor. In some cases students are automatically enrolled in both courses to guarantee a place in the classes for the entire term of instruction. The College mathematics faculty members are to be commended for efforts to offer compressed basic skills course instruction during the primary terms. They have created Integrated Algebra (MATH 235) and Integrated Pre-Algebra (MATH 411) basic mathematics courses and have experienced some increased success.
The math faculty members have expressed an interest in offering more of the compressed basic skills course sections and the College may want to consider supporting that interest.
The ESL curriculum has a lengthy set of courses for students to complete before they can access college-level instruction.
It might be useful for the ESL program to consider a compression strategy and adding some advanced options for students. The College may want to consider supporting that interest to expand these efforts.
Changing placement policies using robust multiple measures, such as the high school transcript data, broadens access to transfer-level courses and makes outcomes equitable for multiple subgroups of students. While currently only 19% of entering students are eligible under existing practices, national research estimates that 64% of entering students could succeed in college transfer-level English if allowed to enroll directly. Half of entering students could succeed in college math if allowed to enroll directly while only 25% are eligible under existing practices.50 The California Multiple Measures
![]()
50 Judith Scott-Clayton. Do High Stakes Placement Exams Predict College Success? Community College Research Center, Teachers College, Columbia University. Working Paper #41, 2012.
Assessment Project found that 72% of community college students could be placed into college English using the overall high school GPA and English course GPA data.51 At least two pioneering California community colleges (Butte and Long Beach) are testing this concept. Reports are favorable. Access to college English was doubled at Butte and quadrupled at Long Beach with success rates that remained steady and equity gaps narrowed.52 In the Virginia Community College system, completion of college-level math tripled after implementation of a pathways approach to placement.53 The College was initially scheduled to implement the statewide common assessment system in 2018, but that schedule has been put on hold. Also, in 2016 the College conducted a pilot project using multiple measures procedures to place students and those results were encouraging. The English department faculty members have elected to use a formal high school GPA as part of the multiple measures in placing students directly into ENGL 1A (freshman composition).
Given the reported positive outcomes from the California and national research, as well as the pilot project results, the College may want to consider expanding the multiple measures course placement effort.
The strategy of using co-requisites allows students who are characterized as being “below transfer level,” to enroll in a transfer-level course that is in a co-requisite relationship with a support class commonly taught by the same instructor. The positive outcomes in multiple states have been impressive.54 Using a controlled experimental design the City University of New York found that the majority of students passed college statistics with supplemental instruction, and the pass rate was nearly 29% higher than in the control group of students who initially enrolled in elementary algebra.55 Four North Carolina community colleges found that completion for college English was 1.6 to
2.3 times higher than in traditional remediation, and equity gaps narrowed or disappeared completely.56 The College English faculty members are to be commended for efforts to offer co-requisite/learning community basic skills course instruction during the primary terms (ENGL 250P, Practical Writing and ENGL 260P, Preparation for College
![]()
51 Craig Hayward, John Hetts, Terrance Willett, et. al. Using Decision Trees to Predict Course Success in the Multiple Measures Assessment Project. Presentation at the Research and Planning Group Annual Conference, April 2015.
52 Leslie Henson and Kati Hern. Let Them In. Research and Planning Group Perspectives. November/December 2014; Long Beach City College. Promising Pathways. 2014. Retrieved from http://www.lbcc.edu/promisepathways
53 Olga Rodriguez and Nikki Edgecombe. Early Findings From Statewide Developmental Education Reform in Virginia and Florida. Presentation at the League for Innovation annual conference, March 9, 2015; Hoori Kalamakarian, Julia Raufman, and Nikki Edgecombe. Statewide Developmental Education Reform: Early Implementation in Virginia and North Carolina. Community College Research Center, Teachers College, Columbia University. May 2015.
54 Complete College America. Corequisite Remediation: Spanning the Completion Divide. Spring 2016; Iris Palmer. How to Fix Remediation at Scale- Colorado Example. New America. March 2016; Is Corequisite Remediation Cost Effective- Early Findings from Tennessee. Community College Research Center, Teachers College, Columbia University. Research Brief #62, 2016.
55 Alexandra Logue et. al. Elementary Algebra or Statistics. Paper delivered at the American Educational Research Association Conference. April 19, 2015.
56 Dawn Coleman. Replicating the Accelerated Learning Program. Center for Applied Research. 2015.
Reading). The College has experienced some increased success with this strategy and the English department has elected to embrace this integrated/corequisite writing and reading model with ENGL 250 and 260 as a self-placement opportunity.
The College is encouraged to expand these efforts.
Some institutions have successfully pursued a strategy of embedding basic skills instruction into discipline courses. Another common approach, contextualization, uses concrete applications in a specific context that is of interest to the students.57 The teaching process is built on the recognition that some students learn more effectively when they are taught in a hands-on, real-world context rather than in an abstract manner. The currently popular reading apprenticeship initiative is perhaps another example of this embedded approach. The College has adopted this strategy in several disciplines with positive results.
Therefore, the College is encouraged to continue those efforts and may want to explore ways to expand the idea further.
The English faculty members have created ENGL 411, Reading and Writing Workshop, as a blended instructional package for basic skills students. There has been some success in moving the students forward in the basic skills curriculum progression.
The College is encouraged to expand these efforts.
The high proportion of entering students placed into remedial math (85%) in combination with the analysis of the a common math course required for the transfer degrees (Statistics) points to another acceleration strategy that may merit attention. The Carnegie Foundation for the Advancement of Teaching has sponsored a national program,
![]()
57 C. Mazzeo. Supporting Student Success at California Community Colleges. Career Ladders Project. 2008. Dolores Perin and Rachel Hare. A Contextualized Reading-Writing Intervention for Community College Students. Community College Research Center, Teachers College, Columbia University. May 2011. Elaine Baker, Laura Hope, Kelley Karandjeff. Contextualized Teaching & Learning: A Faculty Primer. Research and Planning Group. 2009.
MATH 5, Statistics, is the most common transferable mathematics course named in seven non-STEM AD-T course lists. As of spring 2017 there are 13 other non-STEM AD-Ts where no math course is identified, but Statistics would be a logical choice. The College math faculty members created MATH 242, Algebra II for Statistics, to prepare students for Statistics instruction, but reported that it was not as successful as they hoped it would be.
The institution might want to revisit the MATH 242 experience and explore ways to make the instruction more effective.
This acceleration strategy, sometimes described as Statway, is now fully accepted by the University of California and the California State University systems.59
Also, the College might want to consider assisting non-STEM major transfer- oriented students by identifying Statistics, or another non-calculus course, as a general education area B4 course in the AD-T course lists.
If there is curriculum alignment between the Algebra II course taught in the high schools and the Intermediate Algebra course taught at the College, there may be a basis for a credit by examination opportunity.
The College might want to consider the possibilities of developing a credit-by- examination experience for high school students who are completing the Algebra II course in high school. If successful, those students might be granted College credit (Intermediate Algebra) for that high school course.
At least one college, Antelope Valley, has had significant success in administering a math diagnostic exam, modularizing the basic skills math sequence, and allowing students to move forward with self-paced instruction using EducoSoft learning materials.60 Several California community colleges (Antelope Valley, Barstow, Foothill, Los Angeles Trade Technical, Los Medanos, Mt. San Jacinto, Ohlone, and Pasadena) have implemented EdReady software materials from the National Repository of Online Courses to provide
![]()
58 Nicole Sowers and Hiroyuki Yamada. Pathways Impact Report. Carnegie Foundation for the Advancement of Teaching. 2015.
59 UC/CSU Path Cleared for Statistics Pathways, October 20, 2015. Retrieved from http://cap.3csn.org/2015/10/20/uccsu-path-cleared-for-statistics-pathways/. See also Office of the Chancellor. California State University. Statistics Pathways in CSU Quantitative Reasoning. October 20, 2015 and University of California. Special Regulations for Courses in Specific Subject Areas. Retrieved October 20, 2015 from http://ucop.edu/transfer-articulation/transferable-course-agreements/tca- policy/regulations-by-subject-area.html#s.
60 Bonnie Suderman, Vice President for Academic Affairs, Antelope Valley College. Board Goals Progress Presentation. May 10, 2016.
modularized practice in math topics. Two CSU campuses (Long Beach and Monterey Bay) have implemented the program.
The College might want to evaluate this option as another approach to basic skills instruction.
The California State University system appears to be making changes to their approach to academic preparation for incoming freshmen and transfer students. In March 2017 the Board approved four areas for academic preparation policy amendments: (1) developmental education; (2) placement and assessment; (3) Early Start; and (4) high school quantitative reasoning requirements.61 There is a promise not to rush the requirement that freshmen must complete a fourth year of high school quantitative reasoning as CSU preparation. That change is rooted in the Quantitative Reasoning Task Force report from the system Academic Senate.62
Dual Enrollment- AB288
The most recent legislation to promote collaboration, AB 288 that took effect in January 2016, authorizes the governing board of a community college district to enter into a College and Career Access pathways (CCAP) partnership with the governing board of a school district. The partnerships offer or expand dual enrollment opportunities for students who may not already be college bound or are from groups underrepresented in higher education. The goal is to develop a seamless pathway from high school to community college for career-technical education or preparation for transfer, by improving high school graduation rates or helping high school students achieve college and career readiness. The following are the highlights of the legislation:
Community colleges can assign priority “no fee” enrollment and registration to CCAP high school students;
Community college courses during the regular high school day can be restricted to high school students and do not have to meet the normal open enrollment standard;
Courses with no available seats on campus cannot be offered at high schools through the CCAP because the public must have access to the course;
Basic skills math and English can be offered through CCAP, but only for students who are not at grade level in that subject; and,
Community colleges can claim FTES if the high school student is qualified for full high school apportionment without using hours of the college course.
The College is in discussions with several K-12 districts regarding a CCAP agreement and a dual enrollment program.
![]()
61 California State University, Graduation Initiative. Academic Preparation Frequently Asked Questions. Updated April 21,2017. Retrieved April 22, 2017 from https://www2.calstate.edu/csu-system/why-the-csu- matters/graduation-initiative-2025/documents/academic-preparation-faq.pdf
62 California State University, Academic Senate. Quantitative Reasoning Task Force Report. August 1, 2016. Retrieved April 22, 2017 from http://www.calstate.edu/AcadSen/Records/Reports/index.shtml
The College is encouraged to continue exploring ways to use the CCAP concept to expand the CTE curriculum areas into partnerships.
Transfer Enrichment-The College does offer a limited number of academic courses at the local high schools under a program known as High Step. Participating students must qualify as special admissions to the College and the classes are open to the public. See areas for policy and practice modification below.
Improving High School Preparation- As long ago as 2003, a task force of high school teachers and CSU faculty members developed the Expository Reading and Writing Course (ERWC). It is a rigorous, rhetorically based, full-year college preparatory English course designed to support college-readiness in English for high school seniors. The UC has approved the ERWC for area B credit of the A-G requirements and the course meets college preparatory requirements for CSU.63 It has been adopted by upwards of 700 comprehensive high schools.
Throughout the CSU system, and at CSU San Bernardino (CSUSB) in particular, there is now a keen interest in developing in-service professional development materials for middle and high school math teachers. In addition, the CSU System Office and CSUSB leadership have an interest in developing a mathematics course for high school seniors that would be like the ERWC course for English.
The College may want to consider encouraging all three public school districts in the College service area to monitor the CSU math initiative.
Possible Areas of Policy and Practice Modification
Collaborations with the public school districts.
The College is currently doing a number of very positive things with the public school districts. For portions of the service area where educational attainment among adults is the lowest, the College may want to consider intensifying those efforts around the theme of building a college-going mindset and the concept of community or rural development.
The College partners with the Gilroy Unified School District to operate the Dr. T.J. Owens Gilroy Early College Academy through funding provided by the Bill and Melinda Gates Foundation.
The College offers a high school transfer enrichment program, called High Step, on selected high school campuses each year. The college courses offered are transferable and designed for juniors and seniors who have the
![]()
63 Expository Reading and Writing Course. Retrieved May 7, 2016 from www.calstate.edu/cap/englishcourse
ability to benefit from advanced scholastic work. High Step is a concurrent enrollment program.
The College may want to consider ways to expand this program, perhaps using the authority found in AB 288.
The Gavilan Community College Superintendent/President meets jointly with the local K-12 Superintendent/Presidents.
English faculty members are engaged in curriculum alignment and readiness expectations discussions with their K-12 counterparts.
The College may want to consider discussions to encourage the feeder public school districts to embrace and implement the CSU-developed Expository Reading and Writing Course (ERWC) curriculum.
Math faculty members are in the process of offering professional development to high school math faculty who are interested in teaching the College-developed math boot camp curriculum to the high school students who need a math refresher. Both Sierra and Riverside City Colleges have partnered with public high schools in the development of a senior year math course that is taught by the high school faculty to enable their students to be college ready upon graduation.
The College may want to consider a similar effort. The College also may want to encourage all three public school districts in the service area to monitor the CSU math initiative to potentially create a math course that would function like the ERWC.
The student services team at the College has been engaged with the public school districts in several ways. All matriculation steps are conducted at the local high schools as part of fall recruitment – admissions, assessment, Kick Start, work with students with disabilities, and in some cases, registration workshops. Twice a year there is an on-campus event with high school counselors and the College counseling staff. The College also has reduced the manual processes high school students formerly used for registering and that has helped with public relations and service-delivery. The College also teaches the two-unit GUID 6, Life Skills for Higher Education course at some of the high schools. Santa Barbara and Bakersfield Colleges have had very good success with these collaborations and the Get Focused-Stay Focused guidance program.
If additional revenues are available, the College might want to consider engaging the public school districts in
a discussion about jointly implementing the Get Focused-Stay Focused guidance program,64
The College has been working diligently, through AEBG leadership and efforts by the CTE dean and faculty members, to create partnerships and pathways from high school to college curriculum that include additional articulation agreements and dual enrollment opportunities. Development of materials that clearly demonstrate the career opportunities and salaries in each discipline is being addressed.
The College is encouraged to continue these efforts and move as quickly as possible to solidify the partnerships that will support dual enrollments and smooth transition to the College.
The College has twice partnered, through federal grants, with both CSUMB and SJSU.
The College is a leading member of the South Bay Regional Training Consortium and constructed the Coyote Valley property to host public safety training.
The College has enjoyed considerable support from the Bay Area Consortium for Community Colleges (BACCC) in regard to new career and technical education program initiatives.
The College and community are well served by these regional efforts to leverage scarce resources and to address common regional needs.
Among California community colleges, the Long Beach College Promise was established in 2008 to offer a clear pathway for Long Beach Unified School District students.
Starting with high quality early childhood education, the district removes barriers and provides incentives, services, and support for seamless transition from grade school to higher education. Long Beach City College offers the first semester free of fees to graduates from the Long Beach Unified School District who enrolls as full-time students
![]()
64 For additional information about the program see http://www.getfocusedstayfocused.org/
65 Timothy Bartik, et. al. The Effects of the Kalamazoo Promise Scholarship on College Enrollment, Persistence, and Completion. Upjohn Institute Working Paper 15-229. Kalamazoo, MI. W.E. Upjohn Institute for Employment Research, 2015.
in the fall semester following graduation. That incentive is funded by the Long Beach City College Foundation and saves each student more than $600. In fall 2015 the tuition- free offer was expanded to cover the first full year for students in good academic standing.66 In September 2016 Governor Brown signed AB 1741 to incentivize partnerships between local school districts and higher education institutions.
Legislative bodies in Tennessee, Oregon, and Minnesota have enacted legislation to establish similar programs. More than 150 communities in 37 states have implemented similar programs. In his 2015 State of the Union address President Obama articulated a vision for America’s College Promise to make two years of community college free. The American Association of Community Colleges joined that vision by announcing a commitment to the College Promise Campaign.
In 2016-17 Gavilan College applied for state college promise funds.
The College is encouraged to continue exploring the College Promise idea. If public funding of the College Promise proposal is not available, the College may want to contemplate the viability of launching a private fundraising campaign to implement a Gavilan Promise program.
The College is encouraged to continue those revival activities.
Given the characteristics of the student body and the residents in the official college service area, pursuing or reapplying for some of the federal grants listed below may be an option that the College might want to consider. The College has applied for the Upward Bound grant.
Upward Bound (UB) The goal of Upward Bound is to provide certain categories of high school students with better opportunities for attending college. The categories of greatest concern are those with low income, those with parents who did not attend college, and those living in rural areas. The program works through individual grants, each of which covers a restricted geographic area and provides services to approximately 50 to 100 students annually.
![]()
66 Long Beach College Promise. Annual Report to the Community. September 2015
Talent Search (TS) identifies junior high and high school students who might benefit from intervention strategies meant to increase the chances of the student pursuing a college education. There are currently more than 475 TS programs in the U.S. serving more than 389,000 students. At least two-thirds of the students in each local TS program must be from low-income economic backgrounds and from families where parents do not have a bachelor’s degree. Local programs are required to demonstrate that they meet federal requirements every five years in order to maintain funding.
Student Support Services (SSS) receives funding through a federal grant competition. Funds are awarded to institutions of higher education to provide opportunities for academic development, assist students with basic college requirements, and to motivate students toward the successful completion of their postsecondary education. SSS projects also may provide grant aid to current participants who are receiving Federal Pell Grants. The goal of SSS is to increase the college retention and graduation rates of its participants.
The Educational Opportunity Centers program (EOC) provides counseling and information on college admissions to qualified adults who want to enter or continue a program of postsecondary education. The program also provides services to improve the financial and economic literacy of participants. An important objective of the program is to counsel participants on financial aid options, including basic financial planning skills, and to assist in the application process. The goal of the EOC program is to increase the number of adult participants who enroll in postsecondary education institutions.
Veterans Upward Bound (VUB) is designed to motivate and assist veterans in the development of academic and other requisite skills necessary for acceptance and success in a program of postsecondary education. The program provides assessment and enhancement of basic skills through counseling, mentoring, tutoring, and academic instruction in the core subject areas. The primary goal of the program is to increase the rate at which participants enroll in and complete postsecondary education programs.
Upward Bound Math-Science (UBMS) was first authorized through the Higher Education Act of 1965 and reauthorized in the Higher Education Opportunity Act of 2008. Participating students must have completed the eighth grade and be low- income or "potential first-generation college students", with two-thirds of selected applicants meeting both of the criteria. The program provides counseling, summer programs; research, computer training, and connections to university faculty with the goal of improving students' math and science skills and helping them obtain degrees and careers in the math and sciences. Students in the summer program attend five weeks of English, math, and science classes in the summer months. Mathematics classes include algebra, geometry, pre-calculus, and calculus.
Science courses are held for biology, chemistry, and physics. After completing the program, the student receives one college credit from the associated institution.
The College has done some curriculum and program alignment work through prior Title V grants with SJSU and CSUMB. Through the Learning Commons a Faculty Inquiry Group (FIG) has explored this topic. Guided pathway is a focal point in the current Title V grant. A steering group has been formed with an eye to incorporating the ideas into the action plans from basic skills, student equity, and the SSSP work groups. The California Career Ladders program will help develop the leadership capacity to implement guided pathways through two summer workshops.67
To advance this agenda the College may want to consider the following.
Organize the programs of study into clusters of related subject matter- a form of “meta-majors”. The intent is not to introduce new programs of study. Rather, the intent is to group, package, and market existing related programs of study.
Determine which courses each cluster might have in common and use those as the initial registration advice to students who are not entirely certain of a major but reasonably sure of their general interests.
Explore the rationale for offering multiple degrees and certificates in the same discipline and the extent of different requirements between/among them. Seek to eliminate the complexity and multiplicity of programs of study. There are 13 potential “duplicate” degrees.
Accelerate the work with public school districts to craft career and technical education curricular pathways from high school to the College to minimize duplicative instruction and provide current career information (occupations, representative duties and salaries, expected levels of preparation, etc.) that will help a student make a choice among programs of study.
Additional educational pathways for in-need populations through partnerships with County social service agencies and correctional systems.
![]()
67 Karen Warren, Activity Director for Title V Grant. Personal Correspondence. April 18, 2017
Economic Development Division have developed a perspective on industry certifications. The perspective from these leadership groups is that career and technical education programs of study designed for immediate job entry should, when possible, align with industry-recognized certifications that have labor market value. Several of the career and technical education programs in the College 2015-2017 Catalog state that the program of study prepares a student for an industry certification or a state/national license examination, but others do not.
The College may want to contemplate revising public relations materials to highlight preparation for industry certifications and state/national licenses, where they exist. The College also may want to consider strengthening those programs of study that do not currently align to an industry-recognized and valued certificate or license. The relationships between career and technical programs and industry-recognized certifications could become a major marketing tool for the College.
Scheduling- The analysis of schedule patterns for the baseline term at the main campus pointed to several areas for potential improvement. The College might want to review:
The overall way in which future schedules of classes are developed and the information upon which those decisions are made and by whom.
The number of classes scheduled to meet on multiple days, but not using the dominant two-day pattern of Monday and Wednesday or Tuesday and Thursday.
The number of classes scheduled one-day-a week in the prime morning hours.
The modest number of classes scheduled during the first instructional period, in the evenings, on Friday, or Friday and Saturday.
The starting time for evening classes and its impact on creating a seventh instructional period during the day.
The implemented scheduled frequency and sequence of courses named in the AD- Ts.
The College may also want to consider implementing a waiting list procedure to acquire additional information about the numbers of students who wanted to take a course but had no way to communicate that interest once the course sections were full. In addition, a waiting list would provide information to the faculty upon which they could make defensible decisions as to which students are allowed to join a class where there are some “no show” cases and seats are suddenly and unpredictably available.
International Students- The College has previously expressed a value that students respect differences in cultural and linguistic backgrounds, become an effective citizens, and aspire to embrace and celebrate diversity.68 The College also recognizes the need to prepare students for a globalized workforce market. These values and aspirations are found in the College curriculum, co-curricular programs, the international student program, as well as the long-standing study abroad summer program.
![]()
68 Gavilan College. 2015-16 Catalog
To advance these values and aspirations the College may want to consider
Developing an English Language Institute,
increasing the effort to recruit a limited number of additional international students, and
partnering with a residential community developer to construct a limited number of residential units that could be provided to international students.
Important additional considerations are found in the 2015 report on this topic.69
The high cost of housing in the service area may make it difficult for prospective new faculty and staff members, who do not already live in the area, to accept an employment offer.
The College may also want to consider the construction of housing to be offered for a limited period of time to new out-of-area employees.
Possible Areas of Curriculum Expansion/Modification
There are a limited number of curriculum areas in which the College may want to consider making adjustments.
Patient Navigator- The College has established programs in Home Health Aide and Certified Nursing Assistant. The California Department of Health Services regulates instructional programs and individual licensing. The projected regional occupational openings for these occupations are strong and the occupation has been cited as one of the fastest growing jobs in the region.70 The College web page for allied health programs features hot links to both the Certified Nursing Assistant and Home Health Aide programs.
The College might want to consider extending these programs to provide a patient navigator certificate. Program graduates would be equipped to offer clinical advocacy and care management services for patients.
The College has a business curriculum available and provides an AD-T in Business Administration designed for transfer to the CSU. The College also offers Associate Degrees in Retail Marketing, Accounting, and Business.
![]()
69 Hoffman, Song. Report to Gavilan College Regarding Reviewing and Strategically Planning of International Enrollment. December 2015
70 Employment Development Department, Labor Market Information. Occupational Projections for Santa Clara, Santa Cruz, San Benito, Monterey Counties 2014-2024 and Centers of Excellence. Establishing Patient/Health Navigator Programs. August 2015
Chairs (WAFC), but many colleges have their own distinct retail and office management curriculum offerings to assist those who enter the workforce to advance into supervisory positions.
The College may want to consider exploring this possibility with local businesses.
The College may want to explore this possibility with local businesses and developing ways to support entrepreneurial interests.
The College may want to reflect on the student learning outcomes for the current curriculum to consider the extent to which the curriculum as a whole nurtures these skills.
Each was related to one or more industry-valued certifications. The College offers a curriculum in computer applications and computer information science and is reported as a venue for the BIW level 1 courses. However, the BIW statewide branding does not clearly appear in the catalog and may not be widely advertised. The recently released skill builders wage success data indicate that employed students who return to the College to learn additional computer information systems or office technology/office computer applications skills experience a substantial salary increase.
The College may want to consider aggressively marketing this program of study and expanding that curriculum to include some of the skills expected at the level 2 of this emerging occupation.
The College may want to consider aggressively marketing these programs of study and expanding that curriculum.
security of information systems, similar to the CISCO academy curriculum commonly offered by community colleges around the state, and culminating in completion of industry certifications.71 The College offers a degree and certificate of achievement in computer networking leading to the A+ hardware exam and an entry-level certificate of proficiency in computer hardware. However, none of these are described with the statewide branding of Information Technology Technician. The second and third option curriculum area may be beyond the capacity of smaller institutions to support. Only a handful of colleges have been identified as offering curriculum for the information technology technician pathway.
The College may want to consider matching the current curriculum to the state-model curriculum patterns, expanding that curriculum to include some of the skills expected at the stage two and three of this emerging occupation, and aggressively marketing this program of study.
New Career and Technical Education Possibilities
There are few career and technical education programs of study that the College may want to evaluate as potential new programs. These suggestions are offered in support of the College goals previously cited in this Plan and are in addition to the one new associate degree for transfer programs of study previously cited in the visions portion of this chapter.
The College may want to consider exploring a niche in this occupation to make the program distinctive.
Perhaps the community education efforts will evolve into a credit program.
The Bay Area Consortium for Community Colleges (BACCC) has completed an advanced manufacturing sector analysis for occupations that require innovative applications of technologies, processes, and methods to product design and production. Several of the 28 colleges in the large San Francisco Bay area offer advanced
![]()
71 Centers of Excellence and the Information and Communication Technology and Digital Media Sector Navigation Team. Information Technology Technician Pathway Labor Market Analysis. November 2015
manufacturing related programs of study. The occupational projections look promising, but capital equipment investments for these kinds of programs are commonly high.
The College may want to consider this option when proper facilities are available.
Welcome to Gavilan, Fall Term 2016
Table 54: Bay Area Advanced Manufacturing Occupational Analysis
Demand 2015-2018 Hourly Wage 2016
2012-2015
Average
SOC Code Occupations 2015 Jobs
Annual Growth
Annual Openings
Entry
Level Median
Entry Education
Annual Awards
51-4041 | Machinists | 8,000 | 0.8% | 360 | $14.00 | $25.00 | HS Diploma | 235 for both |
51-4012 | CNC Machinists |
51-4121.06 | Welding (welders, cutters, & | 5,700 | 1.2% | 250 | $13.00 | $21.00 | HS Diploma | 352 |
welder fitters) |
49-9041 | Industrial Machinery Mechanics | 5,000 | 3.0% | 300 | $18.00 | $28.00 | HS Diploma* | 354 |
(industrial maintenance technicians) |
17-3023 | Electronics Technicians | 9,500 | 0.5% | 310 | $21.00 | $30.00 | Associate | 398 |
*further development of programmable logic conroller (PLC) and troubleshooting classes is needed
Source: Bay Area Consortium of Community Colleges
Unmanned Aerial Systems (UAS)- The College plans to introduce a low-unit certificate program in drone technology. Several accredited institutions have degree programs of study in UAS operation, management, maintenance, and even design. Other institutions have hands-on unaccredited training programs or student groups and university research friendly to the emerging drone technology.72 The College plans to offer summer Cyber Patriot camp experiences to middle and high school students as a way to spark interest.
![]()
72 Retrieved March 26, 2017 from http://www.dronethusiast.com/top-universities-unmanned-aerial-system- programs/
require certification, but if they do they favor the Certified Coding Associate or the Certified Coding Specialist/Physician-based certifications.73
Teknova was established in 1996 to focus on the molecular biology research market to support researchers looking for pre-poured agar plates or custom products with a fast turnaround. Perhaps the community education efforts will evolve into a credit program. The Bay Area Consortium for Community Colleges (BACCC) has completed a life sciences/biotechnology sector analysis for occupations that require the application of biological scientific knowledge. Five of the 28 colleges in the large San Francisco Bay area offer bio-manufacturing programs of study. The occupational projections look promising.
Table 55: Bay Area Bio-manufacturing Occupations Analysis
Deman | d 2015-2018 | Hourly Wage 2016 | 2012-15 | |||||
SOC Code | Occupations | 2015 Jobs | Annual Growth | Annual Openings | Entry Level | Median | Entry Education | Average Annual Awards |
19-4021 | Biomanufacturing Technician | 5,130 | 2% | 266 | $17.70 | $29.60 | Bachelor's* | 245 for all three |
Bioprocess Technician | ||||||||
Operations/Production Technician | ||||||||
51-9061 | Research/Lab Technician (inspectors | 12,225 | 1% | 458 | $12.75 | $20.75 | HS Diploma | 245 for all three |
testers, sorters, samplers, weighers) | ||||||||
19-4099.01 | Quality Control Technician (analyst, | 3,525 | 2% | 300 | $15.50 | $24.90 | Associate | 245 for all three |
part of Life-Physical Science Tech | ||||||||
all other) | ||||||||
*30% employed nationwide in 2012-13 had a community college award or some postsecondary coursework (Am Community Survey) | ||||||||
Source: Bay Area Consortium of Community Colleges
![]()
73 Centers of Excellence. Medical Coders in San Francisco Bay Region. 2015
The following are the key assumptions to guide future planning activities.
National and state goals and policy for postsecondary education will increasingly emphasize:
degree and certificate completion;
transfer to four-year universities;
reduction of achievement gaps among various subgroups of students; and,
containment of institutional costs.
To promote more effective community colleges some have argued that the institutions should be redesigned.74 The College may want to explore those arguments and consider some of the policies and practices that the Aspen Institute has identified among the colleges to which it has awarded its $1 million dollar prize for excellence.75
Whether ACCJC remains or some other entity becomes the accrediting body for the College, an accreditor will likely continue to insist upon adequate capacity to provide educational services and demonstrable commitment to continuous quality improvement. In regard to effectiveness, an accreditor will place emphasis on results of both student achievement and learning outcomes.
The funding needs for capital projects throughout the California community college system are greater than what the State presently provides. Until fall 2016, key public policy makers were reluctant to ask the public to consider additional general bond obligation debt for those purposes. A bond measure did pass that will bring $2 billion for construction work in the community colleges However, as those modest State capital construction bond funds are available, preference in allocation most likely would be given to colleges demonstrating good use of their facilities and growth in face-to-face instructional contact. Therefore, the College must optimize the efficient use of existing facilities.
A significant change in public policy regarding the CSU transfer process has been implemented with the SB 1440/440 legislation. The UC has started a similar transfer pathway framework. The College has responded to those public policy changes by adopting Associate Degrees for Transfer (AD-Ts). The ongoing challenge will be to connect students to those pathways and perhaps cautiously
![]()
74 Bailey, Thomas, et. al. Redesigning America’s Community Colleges: A Clearer Path to Student Success. Harvard University Press, 2015. American Association of Community Colleges. Reclaiming the American Dream: Community Colleges and the Nation’s Future. 2012. See also. Completion by Design at http://www.completionbydesign.org/.
75 Wyner, Joshua. What Excellent Community Colleges Do: Preparing All Students for Success. Harvard Education Press, 2014.
expand the number of AD-Ts if they can be sustained and are a good fit for the local needs.
The recommendations made by the Board of Governor’s Task Force on Workforce, Job Creation, and a Strong Economy is beginning to translate into a series of new policy, program, and funding initiatives for career and technical education.76 Future additional funding support will be dependent upon the health of the State economy.
The current and future planning environment is very fluid (e.g., resources and legislative mandates). The state of California, and by extension the community college system, has a set of revenue generation laws, policies, and practices that result in volatile levels of revenue. During the Great Recession the revenue reductions were unprecedented in both the steepness of the decline and in the number of consecutive years in which they were sustained. Elements of performance-based funding are working their way into categorical program and workforce development program funding. The College will need to be nimble and collaborative by engaging in interdepartmental dialogue on the campus. Additionally, the College will need to continue to be fiscally prudent and to use revenues efficiently.
Technology can be a disruptive factor both in the broader society and in higher education. It represents an evolving challenge to faculty members who need to teach some students how to use it while offering instruction in the same class to some students who may be very skilled in using the technology.77 A variety of technological applications for the classroom and instruction are promising, but faculty must learn to use them and the effectiveness of the technology needs to be empirically evaluated. The current State-sponsored Online Education Initiative (OEI) holds great promise for the improvement of the online instruction experience for learners and faculty members. Technology is also a force with which to be reckoned in the delivery of administrative and instructional support services. 78
Transferable core abilities, commonly expressed in the learning outcomes associated with general education, will likely never go out of fashion and are highly valued by employers.79 However, weaving a coherent curriculum that
![]()
76 California Community College Chancellor’s Office. Board of Governors Task Force on Workforce, Job Creation, and a Strong Economy: Report and Recommendations. November 2015.
77 Carl Straumsheim. “Digital Distractions,” Inside Higher Education. January 26, 2016.
78 Ryland, Jane N. (President Emerita, CAUSE). Technology and the Future of the Community College. Retrieved from http://www.aacc.nche.edu/Resources/aaccprograms/pastprojects/Pages/technologyfuture.aspx on January 15, 2016; Massachusetts Institute of Technology. Online Education: A Catalyst for Higher Education Reforms. April 2016.
79 Hart Research Associates. Falling Short? College Learning and Career Success. January 2015 (survey conducted on behalf of the Association of American Colleges and Universities).
effectively fosters those talents is an ongoing challenge for any higher education institution.
Change in late adolescent and adult demographics (racial composition, ethnic identities, age cohorts) is the future of the effective service area. The primary college age cohort (18 to 24) will become proportionately a little smaller in effective service; but the group’s size will average around 112,000 potential students. The College will always have to “sell itself” to the community of prospective students.
Substantial numbers of residents are limited in their ability to participate in the local economy due to shortcomings in their academic capital (English language learners, 8%, and low educational attainment, 24% with no high school diploma) and poverty, 12% of the population. The decision and resources required for outreach to recruit these adults and/or their college-age children will be an ongoing opportunity for the College as well as a challenge to “make room” for them and to help them succeed.
The November 2016 passage of Measure H in Gilroy and Measure S in Morgan Hill reaffirm the commitment in those communities to regulate and slow the pace of residential growth. Conversely, the absence of a similar public policy in Hollister or San Benito County and the substantial number of residential developments already approved suggest that future population growth will be in the southern portion of the District service area.
The implementation of the common core curriculum in K-12 districts may favorably impact the extent to which future students are “college-ready” upon graduation from high school. Currently, substantial portions of those high school graduates who complete the placement assessment exams are recommended to basic skills courses. What brings about these results? Is it the students, the assessment process, poor instruction or a little of all?80 The College may want to revisit the issue of “college ready,” consider strategies to improve the academic talent of prospective students, and explore additional approaches to the process of course placement assessment.
An important public service and an ongoing challenge for the College will be to align instructional programs to the occupations with the greatest job opportunities, some of which will require a bachelor’s degree while others will not.81 Considerable commitment and a willingness to change with the times will be required to design terminal associate degrees and certificates of achievement that
![]()
80 Hanover Research. Planning for the Future in Community Colleges. December 2013.
81 American College Testing. Changing Lives, Building a Workforce. 2015; Public Policy Institute of California. California’s Future: Higher Education. 2016; California Community Colleges. Chancellor’s Office. System Strategic Plan. 2013; California Community Colleges. Chancellor’s Office. Board of Governors Task Force on Workforce, Job Creating, and a Strong Economy. 2015.
culminate in an industry-recognized certification or adequate preparation of students for the examinations to earn those licenses and certifications.
Seventy-six percent of all projected nonfarm job growth opportunities (2014-2024 in Santa Clara and San Benito Counties) is concentrated in four industry sectors:
The private educational services, health care and social assistance industry. (28% of all new jobs).
The professional and business services sector. It represents 37% of all new jobs. Over half of those will be in computer systems design and related services.
Information. With an expected growth rate of 30%, this is the fastest growing sector and will provide 19% of all new jobs.
Leisure and hospitality. This sector will contribute 15% of all new jobs.
The ability to measure and track data is necessary to identify trends in student outcomes achievement. Robust data sets provide faculty, administrators, and staff with timely feedback and information about student outcomes. Exploration of robust data sets allows them to alter or enhance instructional programs and support services. Some have called this process a “culture of evidence.” It can be a challenge to know how to use this information well. That is to say, it is not enough to collect data, but the College must know how to analyze and use the data to make “informed decisions for the classroom, student services, and human resources.”82
The College Educational Master Plan (2013) set out six visionary educational goals.83 These will be revisited in academic year 2017-18.
In August 2015 the Board of Trustees approved a Strategic Plan for the College that was intended to guide the institution from 2015-16 through 2019-2020. That Plan will be revised in the near future, but the document captures seven broad strategies and a set of goals for the College that is outlined in Appendix SP.84
![]()
82 Lorenzo, George (editor-in-chief of the SOURCE on Community College Issues, Trends, and Strategies). Eight Important Questions for Eleven Community College Leaders: An Exploration of Community College Issues, Trends, and Strategies. May 2011.
83 Gavilan College. 2013 Educational Master Plan
84 Gavilan College. Strategic Plan FY 2015-16 Through 2019-2020. August 11, 2015
Dynamics of Future Capacities
Linking the Educational Master Plan’s internal and external analysis to Weekly Student Contact Hours (WSCH) and space quantification completes the process of planning for future instructional capacity. It balances a comprehensive program of campus development with the current curriculum, instructional delivery modes, learning environment, and necessary support structures. The extent and direction of future curriculum development is uncertain, but the visions of future curriculum, the needs of the labor market, interests of prospective students, opportunities provided by the four- year transfer institutions, the College’s mission, and priorities and financial resources of the College are all factors to be considered when charting the future direction of the College.
The current and immediate future economic indicators are improving. The number of new student enrollments is expected to continue to increase and by the year 2020 the College will return to its pre Great Recession growth pattern. Therefore, planning must involve developing a long-term vision as well as meeting short-term goals.
As a dynamic process, educational planning involves a mixture of methods and a variety of assessments. Looking to the future, a master plan must strive to:
assure sufficient facilities to accommodate higher enrollment numbers;
improve the teaching/learning environment;
address new program development;
integrate the latest technological innovations; and,
provide adequate space configuration that permits flexible teaching methods.
By considering the expected economic and fiscal factors out to 2030, a growth projection for WSCH was established for the College at an average annual rate of 3.1%. While modest, this growth represents a reasonable forecast for this College at this time.
In any planning cycle, the projected WSCH is time specific and addresses future needs for increased capacity that may or may not materialize exactly at the times projected. The strategic goal is to plan sufficiently for facilities that are flexible enough to accommodate additional enrollments when they do materialize.
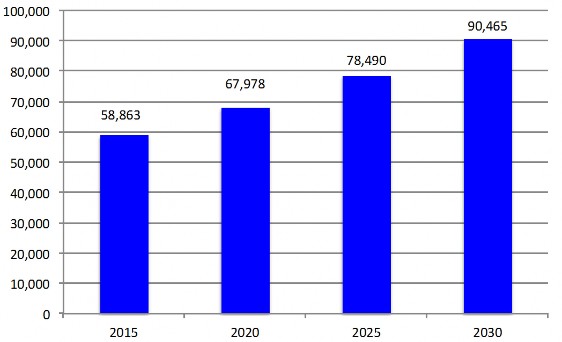
Chart 34: Gavilan College Weekly Student Contact Hours (WSCH) On Campus and Satellites, But Not General Off Campus, JPA, or Apprentice
2015
Source: Cambridge West Partnership, LLC
Gavilan College Main Walkway Area, Initial Days of Classes
The projected unduplicated fall term student headcount is expected to grow annually at 2.1% over the fifteen-year period. The trend of the projection is illustrated on the following table.
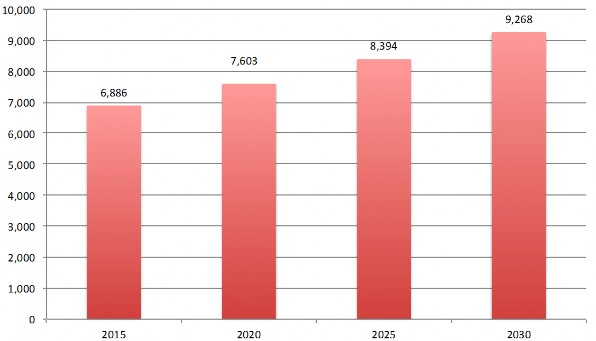
Chart 35: Gavilan College Projected Fall Term Unduplicated Student Headcount
2015
Source: Cambridge West Partnership, LLC
In the baseline term of fall 2015 64% of the individual students were enrolled in one or more classes located at the main campus in Gilroy.
Cambridge West Partnership, LLC
The fall 2015 program of instruction provided a snapshot in time used as a baseline for this EMP. A planning model was created to address the capacities for the future and provided the foundation from which a future program of instruction could be projected.
175
Table 56: Gavilan College On Campus Baseline, Fall 2015
GILROY CAMPUS Nbr. | Seats/ | WSCH/ | % | % | Lec | Lab | ASF | ASF | ASF | ||
Division/Department/Discipline Sect. | Seats | Sect. WSCH | Sect. FTES Lec Lab | Lec | Lab | WSCH | WSCH | Lec | Lab | Total | |
Liberal Arts & Science English Department/ESL | |||||||||||
English 1500 | 77 1,433 | 18.61 4,974.53 | 64.60 161.08 295 41 | 88% | 12% | 4,367.5 | 607.0 | 2,065.8 | 910.5 | 2,976.4 | |
ESL 4900 | 14 175 | 12.50 764.65 | 54.62 24.76 59 0 | 100% | 0% | 764.6 | 0.0 | 361.7 | 0.0 | 361.7 | |
Humanities 0600 Fine Arts | 4 176 | 44.00 588.31 | 147.08 19.05 16 0 | 100% | 0% | 588.3 | 0.0 | 278.3 | 0.0 | 278.3 | |
Art 1000 | 18 472 | 26.22 2,440.63 | 135.59 79.03 53 96 | 36% | 64% | 868.1 | 1,572.5 | 410.6 | 4,041.3 | 4,451.9 | |
Communication 0600 | 20 587 | 29.35 1,876.72 | 93.84 60.77 60 0 | 100% | 0% | 1,876.7 | 0.0 | 887.7 | 0.0 | 887.7 | |
French 1100 | 1 28 | 28.00 145.46 | 145.46 4.71 5 0 | 100% | 0% | 145.5 | 0.0 | 68.8 | 0.0 | 68.8 | |
Journalism 0600 | 1 18 | 18.00 57.75 | 57.75 1.87 3 0 | 100% | 0% | 57.8 | 0.0 | 27.3 | 0.0 | 27.3 | |
Japanese 1100 | 1 26 | 26.00 140.51 | 140.51 4.55 5 0 | 100% | 0% | 140.5 | 0.0 | 66.5 | 0.0 | 66.5 | |
MCTC- TV Film 1000 | 3 18 | 6.00 80.91 | 26.97 2.62 7 6 | 54% | 46% | 43.6 | 37.3 | 20.6 | 96.0 | 116.6 | |
Music 1000 | 8 219 | 27.38 934.19 | 116.77 30.25 17 20 | 46% | 54% | 429.2 | 505.0 | 203.0 | 1,297.8 | 1,500.8 | |
Philosophy 2200 | 3 88 | 29.33 284.43 | 94.81 9.21 9 0 | 100% | 0% | 284.4 | 0.0 | 134.5 | 0.0 | 134.5 | |
Spanish 1100 | 7 189 | 27.00 961.06 | 137.29 31.12 35 0 | 100% | 0% | 961.1 | 0.0 | 454.6 | 0.0 | 454.6 | |
Theatre Arts 1000 | 6 127 | 21.17 444.40 | 74.07 14.39 17 12 | 59% | 41% | 260.5 | 183.9 | 123.2 | 472.6 | 595.8 | |
Library 1600 Natural Sciences & Math | 2 59 | 29.50 58.99 | 29.49 1.91 2 0 | 100% | 0% | 59.0 | 0.0 | 27.9 | 0.0 | 27.9 | |
Astronomy 1900 | 1 42 | 42.00 134.34 | 134.34 4.35 4 0 | 100% | 0% | 134.3 | 0.0 | 63.5 | 0.0 | 63.5 | |
Biology 0400 | 18 464 | 25.78 3,107.69 | 172.65 100.63 64 51 | 56% | 44% | 1,729.5 | 1,378.2 | 818.1 | 3,211.2 | 4,029.2 | |
Chemistry 1900 | 7 220 | 31.43 1,596.62 | 228.09 51.70 23 24 | 49% | 51% | 781.3 | 815.3 | 369.6 | 2,095.3 | 2,464.9 | |
Ecology 0400 | 2 51 | 25.50 331.37 | 165.68 10.73 6 6 | 50% | 50% | 165.7 | 165.7 | 78.4 | 386.0 | 464.4 | |
Environmental Science 0400 | 1 22 | 22.00 145.15 | 145.15 4.70 3 3 | 50% | 50% | 72.6 | 72.6 | 34.3 | 169.1 | 203.4 | |
Geology 1900 | 2 68 | 34.00 461.07 | 230.54 14.93 6 6 | 50% | 50% | 230.5 | 230.5 | 109.0 | 592.5 | 701.5 | |
Mathematics 1700 | 38 1,407 | 37.03 6,986.21 | 183.85 226.22 152 6 | 96% | 4% | 6,720.9 | 265.3 | 3,179.0 | 397.9 | 3,576.9 | |
Mathematics 1700 (Online) | 1 41 | 41.00 122.91 | 122.91 3.98 4 6 | 40% | 60% | 49.2 | 73.7 | 23.3 | 110.6 | 133.9 | |
Physics 1900 | 3 105 | 35.00 686.21 | 228.74 22.22 9 9 | 50% | 50% | 343.1 | 343.1 | 162.3 | 881.8 | 1,044.1 | |
Physical Sciences 1900 | 1 20 | 20.00 66.09 | 66.09 2.14 3 3 | 50% | 50% | 33.0 | 33.0 | 15.6 | 84.9 | 100.6 | |
Physical Sciences 1900 (Online) Social Sciences Anthropology 2200 | 1 28 5 124 | 28.00 84.00 24.80 390.97 | 84.00 2.72 3 3 78.19 12.66 15 0 | 50% 100% | 50% 0% | 42.0 391.0 | 42.0 0.0 | 19.9 184.9 | 107.9 0.0 | 127.8 184.9 | |
History 2200 | 12 461 | 38.42 1,474.94 | 122.91 47.76 36 0 | 100% | 0% | 1,474.9 | 0.0 | 697.6 | 0.0 | 697.6 | |
Political Science 2200 | 4 183 | 45.75 585.53 | 146.38 18.96 12 0 | 100% | 0% | 585.5 | 0.0 | 277.0 | 0.0 | 277.0 | |
Psychology 2000 | 9 364 | 40.44 1,164.88 | 129.43 37.72 27 0 | 100% | 0% | 1,164.9 | 0.0 | 551.0 | 0.0 | 551.0 | |
Sociology 2200 | 9 371 | 41.22 1,198.24 | 133.14 38.80 27 0 | 100% | 0% | 1,198.2 | 0.0 | 566.8 | 0.0 | 566.8 | |
sub total | 279 7,586 | 27.19 32,288.74 | 115.73 1,045.54 977 292 | 77% | 23% | 25,963.6 | 6,325.2 | 12,280.8 | 14,855.5 | 27,136.2 | |
Cambridge West Partnership, LLC
Allied Health 1200 (Online) |
Health Education 1200 Aviation Maintenance Tech Aviation Maintenance 0950 Business Accounting 0500 |
Accounting 0500 (Online) |
Administration of Justice 2100 Business Office 0500 Business 0500 Computer Sci & Info Sys 0700 |
Computer Sci & Info Sys (Online |
Digital Media 0600 |
Digital Media (Online) |
Economics 2200 |
Economics 2200 (Online) |
Law Enforcement 2100 |
Management/Marketing 0500 (Online) |
300.55 48.66 |
72.57 270.84 86.51 116.12 |
117.97 36.75 96.85 45.87 39.74 |
49.49 0.00 |
96.04 63.77 |
143.60 84.00 |
![]()

GILROY CAMPUS
Division/Department/Discipline
CTE
Allied Health
Allied Health 1200
Nbr. Sect.
Seats/ WSCH/
Seats Sect. WSCH Sect. FTES
% % Lec Lab ASF Lec Lab Lec Lab WSCH WSCH Lec
ASF ASF
Lab Total
10
2
2
222
33
45
22.20
16.50
22.50
3,005.47
97.32
145.15
97.32
3.21
4.70
45
9
9
71 39%
12 43%
0 100%
61%
57%
0%
1,177.3
42.2
145.1
1,828.2
55.1
0.0
556.9
20.0
68.7
3,912.3
117.9
0.0
4,469.2
137.9
68.7
3
43 14.33 812.51
26.31
26
34 43% 57% 351.2 461.3 166.1 3,455.5 3,621.6
8
1
8
4
5
22
16
4
2
4
4
1
1
180
29
22.50
29.00
298 37.25
59 14.75
149 29.80
692.07
116.12
943.76
147.00
484.24
402 18.27 1,009.24
286 17.88
66 16.50
8 4.00
119 29.75
85 21.25
61 61.00
29 29.00
635.87
197.96
0.00
384.18
255.09
143.60
84.00
22.41
3.76
30.56
4.76
15.68
32.68
20.59
6.41
0.00
12.44
8.26
4.65
2.72
29
3
45
8
15
101
68
17
0
16
16
0 100%
0 100%
44 51%
6 59%
0 100%
75 57%
38 64%
6 74%
0
0 100%
0 100%
0%
0%
49%
41%
0%
43%
36%
26%
692.1 0.0 327.4 0.0 327.4
116.1 0.0 54.9 0.0 54.9
477.2 466.6 225.7 998.5 1,224.2
87.1 59.9 41.2 76.7 117.9
484.2 0.0 229.0 0.0 229.0
579.2 430.1 273.9 735.4 1,009.4
407.9 228.0 192.9 389.8 582.7
146.3 51.6 69.2 110.5 179.7
0%
0%
384.2
255.1
0.0
0.0
181.7
120.7
0.0
0.0
181.7
120.7
3
0 100%
0%
84.0
0.0
39.7
0.0
39.7

sub total CTE Other
Child Development 1300 Child Development 1300 (Online)
97 2,114 21.79 9,153.57 94.37 296.46 410 284 59% 41% 5,429.2 3,580.8 2,568.0 9,796.6 12,364.6
8 188
4 73
601.59
![]()
23.50
18.25
218.96
19.48
![]()
75.20
54.74
![]()
7.09
29 8 78% 22% 471.5 130.1 202.3
14 4 78% 22% 170.3 48.7 73.1
125.0 327.3
![]()
4,374.7 4,447.8
Cosmetology 3000 4 | 89 22.25 2,127.79 | 531.95 | 68.90 | 16 | 64 | 20% | 80% | 425.6 | 1,702.2 | 182.6 | 3,642.8 | 3,825.3 | ||||||
Coop Work Experience 4930 1 | 11 11.00 28.10 | 28.10 | 0.91 | 0 | 5 | 0% | 100% | 0.0 | 28.1 | 0.0 | 72.2 | 72.2 | ||||||
Water Resource Management 0958 4 | 105 26.25 344.34 | 86.08 | 11.15 | 12 | 0 | 100% | 0% | 344.3 | 0.0 | 147.7 | 0.0 | 147.7 | ||||||
sub total 21 466 22.19 3,320.78 158.13 107.53 71 81 47% 53% 1,411.7 1,779.0 605.6 8,214.8 8,820.4 | ||||||||||||||||||
Kinesiology | Kinesiology 0835 | 18 | 830 | 46.11 | 1,725.09 | 95.84 | 55.86 | 0 | 54 0% | 100% | 0.0 1,725.1 | 0.0 5,537.5 5,537.5 | ||||||
Athletic 0835 | 16 | 372 | 23.25 | 2,423.03 | 151.44 | 78.46 | 11 | 89 11% | 89% | 266.5 2,156.5 | 114.3 6,922.4 7,036.7 | |||||||
sub total 34 1,202 35.35 4,148.12 122.00 134.32 11 143 7% 93% 266.5 1,725.1 114.3 12,459.9 12,574.2 | ||||||||||||||||||
Disability Resource Center Vocational Training 4930 | 8 | 196 | 24.50 | 1,087.06 | 135.88 | 35.20 | 24 | 0 | 100% | 0% | 1,087.1 | 0.0 | 466.3 | 0.0 | 466.3 | |||
Adaptive PE 4930 | 10 | 150 | 15.00 | 458.60 | 45.86 | 14.85 | 24 | 12 | 67% | 33% | 305.7 | 152.9 | 131.2 | 490.7 | 621.9 | |||
Computer Science & Info 4930 | 6 | 55 | 9.17 | 96.66 | 16.11 | 3.13 | 56 | 0 | 100% | 0% | 96.7 | 0.0 | 41.5 | 0.0 | 41.5 | |||
Guidance 4930 | 10 | 276 | 27.60 | 435.44 | 43.54 | 14.10 | 60 | 0 | 100% | 0% | 435.4 | 0.0 | 186.8 | 0.0 | 186.8 | |||
sub total 34 677 19.91 2,077.76 61.11 67.28 164 12 93% 7% 1,924.9 152.9 825.8 490.7 1,316.5 | ||||||||||||||||||
Counseling & Guidance Guidance 4930 | 23 | 561 | 24.39 | 396.53 | 17.24 | 12.84 | 34 | 0 100% | 0% | 396.5 | 0.0 | 170.1 | 0.0 | 170.1 | ||||
Guidance 4930 (Online) | 2 | 55 | 27.50 | 138.04 | 69.02 | 4.47 | 5 | 0 100% | 0% | 138.0 | 0.0 | 59.2 | 0.0 | 59.2 | ||||
sub total 25 616 24.64 534.57 21.38 17.31 39 0 100% 0% 534.6 0.0 229.3 0.0 229.3 | ||||||||||||||||||
| ||||||||||||||||||
Allied Health 4930 (Online) | 1 | 105 | 105.00 | 197.03 | 197.03 | 4.05 | 4 | 0 | 100% | 0% | 197.0 | 0.0 | 84.5 | 0.0 | 84.5 | |||
Guidance 4930 (Online) | 1 | 76 | 76.00 | 2.47 | 2.47 | 0.08 | 2 | 0 | 100% | 0% | 2.5 | 0.0 | 1.1 | 0.0 | 1.1 | |||
English 1500 | 3 | 45 | 15.00 | 256.94 | 85.65 | 0.45 | 3 | 28 | 10% | 90% | 24.9 | 232.1 | 10.7 | 348.1 | 358.8 | |||
Library 1600 (Online) | 10 | 3,999 | 399.90 | 119.51 | 11.95 | 3.87 | 65 | 3 | 96% | 4% | 114.2 | 5.3 | 49.0 | 7.9 | 56.9 | |||
![]()
![]()
843 67% 33% 35,672.1 13,800.2 16,684.6 46,173.4 62,858.0
1,742
CAMPUS TOTAL 505 16,886 33.44 52,099.49 103.17 1,676.89
176
sub total 15 4,225 281.67 575.95 38.40 8.45 70 31 69% 31% 141.6 237.3 60.7 356.0 416.8
SATELLITE CENTERS | Nbr. Sect. | Seats | Seats/ Sect. | WSCH | WSCH/ Sect. | FTES | Lec | Lab | % Lec | % Lab | Lec WSCH | Lab WSCH | ASF Lec | ASF Lab | ASF Total | ||
Hollister Center Credit Guidance Allied Health Health Education Accounting BOT CSIS English Art Communication Philosophy Spanish Mathematics History Psychology Sociology Non Credit Non Credit English Non Credit ESL | |||||||||||||||||
1 | 24 | 24.00 | 12.66 | 12.66 | 0.41 3 | 0 | 100% | 0% | 12.7 | 0.0 | |||||||
1 | 1 | 1.00 | 0.93 | 0.93 | 0.03 0 | 0 | |||||||||||
1 | 28 | 28.00 | 89.56 | 89.56 | 2.90 3 | 0 | 100% | 0% | 89.6 | 0.0 | |||||||
1 | 4 | 4.00 | 9.26 | 9.26 | 0.30 3 | 0 | 100% | 0% | 9.3 | 0.0 | |||||||
1 | 0 | 0.00 | 8.34 | 8.34 | 0.27 3 | 0 | 100% | 0% | 8.3 | 0.0 | |||||||
1 | 5 | 5.00 | 11.43 | 11.43 | 0.37 0 | 3 | 0% | 100% | 0.0 | 11.4 | |||||||
10 | 189 | 18.90 | 680.34 | 68.03 | 22.03 4 | 0 | 100% | 0% | 680.3 | 0.0 | |||||||
1 | 35 | 35.00 | 115.50 | 115.50 | 3.74 2 | 6 | 25% | 75% | 28.9 | 86.6 | |||||||
2 | 65 | 32.50 | 208.15 | 104.07 | 6.74 6 | 0 | 100% | 0% | 208.1 | 0.0 | |||||||
1 | 21 | 21.00 | 67.32 | 67.32 | 2.18 3 | 0 | 100% | 0% | 67.3 | 0.0 | |||||||
3 | 63 | 21.00 | 327.66 | 109.22 | 10.61 5 | 0 | 100% | 0% | 327.7 | 0.0 | |||||||
4 | 151 | 37.75 | 704.43 | 176.11 | 22.81 16 | 0 | 100% | 0% | 704.4 | 0.0 | |||||||
3 | 133 | 44.33 | 399.00 | 133.00 | 12.92 9 | 0 | 100% | 0% | 399.0 | 0.0 | |||||||
2 | 70 | 35.00 | 227.29 | 113.65 | 7.36 6 | 0 | 100% | 0% | 227.3 | 0.0 | |||||||
1 | 33 | 33.00 | 109.01 | 109.01 | 3.53 3 | 0 | 100% | 0% | 109.0 | 0.0 | |||||||
2 | 51 | 25.50 | 93.57 | 46.79 | 3.03 8 | 0 | 100% | 0% | 93.6 | 0.0 | |||||||
4 | 98 | 24.50 | 201.97 | 50.49 | 6.54 6 | 0 | 100% | 0% | 202.0 | 0.0 | |||||||
Subtotal | 39 | 971 | 24.90 | 3,266.43 | 83.75 | 105.77 | 80 | 9 | 90% | 10% | 2,936.1 | 330.3 | |||||
Morgan Hill Center Credit Guidance Admin of Justice CSIS Digital Media Child Development DRC Vocational Training Kinesiology English Art Communication Philosophy Spanish Astronomy Mathematics Anthropology Geography History Political Science Non Credit Non Credit ESL | 1 | 26 | |||||||||||||||
26.00 | 13.90 | 13.90 | 0.45 3 | 0 | 100% | 0% | 13.9 | 0.0 | |||||||||
2 | 45 | 22.50 | 148.54 | 74.27 | 4.81 6 | 0 | 100% | 0% | 148.5 | 0.0 | |||||||
1 | 8 | 8.00 | 26.25 | 26.25 | 0.85 0 | 3 | 0% | 100% | 0.0 | 26.3 | |||||||
1 | 13 | 13.00 | 42.93 | 42.93 | 1.39 3 | 0 | 100% | 0% | 42.9 | 0.0 | |||||||
2 | 20 | 10.00 | 66.09 | 33.04 | 2.14 6 | 0 | 100% | 0% | 66.1 | 0.0 | |||||||
2 | 37 | 18.50 | 107.16 | 53.58 | 3.47 6 | 0 | 100% | 0% | 107.2 | 0.0 | |||||||
1 | 32 | 32.00 | 102.53 | 102.53 | 3.32 0 | 3 | 0% | 100% | 0.0 | 102.5 | |||||||
9 | 194 | 21.56 | 675.71 | 75.08 | 21.88 36 | 0 | 100% | 0% | 675.7 | 0.0 | |||||||
1 | 35 | 35.00 | 115.50 | 115.50 | 3.74 2 | 4 | 33% | 67% | 38.5 | 77.0 | |||||||
2 | 63 | 31.50 | 201.66 | 100.83 | 6.53 6 | 0 | 100% | 0% | 201.7 | 0.0 | |||||||
1 | 24 | 24.00 | 76.90 | 76.90 | 2.49 3 | 0 | 100% | 0% | 76.9 | 0.0 | |||||||
1 | 29 | 29.00 | 150.71 | 150.71 | 4.88 4 | 0 | 100% | 0% | 150.7 | 0.0 | |||||||
1 | 34 | 34.00 | 112.10 | 112.10 | 3.63 3 | 0 | 100% | 0% | 112.1 | 0.0 | |||||||
5 | 190 | 38.00 | 972.49 | 194.50 | 31.49 20 | 0 | 100% | 0% | 972.5 | 0.0 | |||||||
1 | 15 | 15.00 | 49.41 | 49.41 | 1.60 3 | 0 | 100% | 0% | 49.4 | 0.0 | |||||||
1 | 25 | 25.00 | 134.96 | 134.96 | 4.37 3 | 0 | 100% | 0% | 135.0 | 0.0 | |||||||
2 | 65 | 32.50 | 208.15 | 104.07 | 6.74 6 | 0 | 100% | 0% | 208.1 | 0.0 | |||||||
1 | 38 | 38.00 | 121.68 | 121.68 | 3.94 3 | 0 | 100% | 0% | 121.7 | 0.0 | |||||||
3 | 67 | 22.33 | 169.85 | 56.62 | 5.50 9 | 0 | 100% | 0% | 169.9 | 0.0 | |||||||
Subtotal | 38 | 960 | 25.26 | 3,496.50 | 92.01 | 113.22 | 122 | 10 | 92% | 8% | 3,231.6 | 264.9 | |||||
Cambridge West Partnership, LLC
177
ASF ASF ASF | ||||||||||||
Off Site/Off Campus | N Sec | Seats | S/Sec | WSCH | CH/Sec | FTES | Lec | Lab % Le | %La LecWS LabWS Lec Lab Total | |||
Off Site/Off Campus | ||||||||||||
Apprenticeship Prog Wk Exper | ||||||||||||
Carpenter Apprentice 0952 | 37 | 837 | 22.62 | 838.15 | 22.65 | 27.14 | ||||||
Drywall -Lathing 0952 | 18 | 390 | 21.67 | 397.15 | 22.06 | 12.86 | ||||||
Total | 55 | 1,227 | 22.31 | 1,235.29 | 22.46 | 40.00 | ||||||
Credit | ||||||||||||
JFT Fire Technology 2100 | 11 | 205 | 18.64 | 601.59 | 54.69 | 19.48 | 24 | 68 26% | 74% 157.6 444.0 67.6 950.1 1,017.7 | |||
JLE Law Enforcement 2100 | 27 | 574 | 21.26 | 3,201.88 | 118.59 | 103.68 | 29 | 145 17% | 83% 531.5 2,670.4 228.0 5,714.6 5,942.6 | |||
Total | 38 | 779 | 20.50 | 3,803.47 | 100.09 | 123.16 | 53 | 213 20% | 80% 689.1 3,114.3 295.6 6,664.7 6,960.3 | |||
Credit Admin of justice 2100 CDC1 1300 CD2 1300 DRC Vocational Train 4930 DRC Adaptive PE 4930 Kinesiology 0835 English 1500 Humanities 0600 Art 1000 Communication 0600 Philosophy 2200 Spanish !!00 Library 1911 Biology 0400 Anthropology 2200 History 2200 Pol Science 2200 Psychology 2000 Sociology 2200 Non-Credit Allied Health 4930 English 1500 ESL 4930 | 1 | 31 | 31.00 | 1,701.31 | 1,701.31 | 55.09 | ||||||
1 | 4 | 4.00 | 12.04 | 12.04 | 0.39 | |||||||
1 | 11 | 11.00 | 36.44 | 36.44 | 1.18 | |||||||
4 | 121 | 30.25 | 2,927.65 | 731.91 | 94.80 | |||||||
1 | 26 | 26.00 | 109.32 | 109.32 | 3.54 | |||||||
2 | 62 | 31.00 | 190.85 | 95.43 | 6.18 | |||||||
5 | 122 | 24.40 | 365.96 | 73.19 | 11.85 | |||||||
2 | 51 | 25.50 | 158.12 | 79.06 | 5.12 | |||||||
1 | 26 | 26.00 | 78.13 | 78.13 | 2.53 | |||||||
1 | 22 | 22.00 | 72.57 | 72.57 | 2.35 | |||||||
1 | 29 | 29.00 | 87.09 | 87.09 | 2.82 | |||||||
1 | 26 | 26.00 | 130.01 | 130.01 | 4.21 | |||||||
8 | 190 | 23.75 | 185.91 | 23.24 | 6.02 | |||||||
2 | 19 | 9.50 | 57.13 | 28.57 | 1.85 | |||||||
3 | 74 | 24.67 | 222.04 | 74.01 | 7.19 | |||||||
1 | 33 | 33.00 | 99.13 | 99.13 | 3.21 | |||||||
2 | 56 | 28.00 | 168.00 | 84.00 | 5.44 | |||||||
5 | 73 | 14.60 | 222.04 | 44.41 | 7.19 | |||||||
1 | 32 | 32.00 | 96.04 | 96.04 | 3.11 | |||||||
1 | 72 | 72.00 | 54.66 | 54.66 | 1.77 | |||||||
4 | 125 | 31.25 | 149.47 | 37.37 | 4.84 | |||||||
17 | 422 | 24.82 | 1,070.07 | 62.95 | 34.65 | |||||||
Total | 65 | 1,627 | 579.74 | 8,194.01 | 126.06 | 265.33 | ||||||
Subtotal | 158 | 3,633 | 22.99 | 13,232.78 | 83.75 | 428.49 | 52.90 | 212.80 20% | 80% 689.1 3,114.3 295.6 6,664.7 6,960.3 | |||
GRAND TOTAL | 740 | 22,450 | 30.34 | 72,095.20 | 97.43 | 2,324.37 | 1,997 | 1,075 65% | 35% 42,528.9 17,509.8 16,980.2 52,838.1 69,818.4 | |||
Cambridge West Partnership, LLC
178
Cambridge West Partnership, LLC
Note: The following online data is contained in the disciplines above. This data has been assembled for information purposes only.
ONLINE SUMMARY | Nbr. Sect. | Seats | Seats/ Sect. | WSCH | WSCH/ Sect. | FTES | Lec | Lab | % Lec | % Lab | Lec WSCH | Lab WSCH | ASF Lec | ASF Lab | ASF Total | |
Online Credit | ||||||||||||||||
Mathematics 1700 (Online) | 1 | 41 | 41.00 | 122.91 | 122.91 | 3.98 | 213 | 6 | 97% | 3% | 119.5 | 3.4 | 56.5 | 5.1 | 61.6 | |
Physical Sciences 1900 (Online) | 1 | 28 | 28.00 | 84.00 | 84.00 | 2.72 | 3 | 3 | 50% | 50% | 42.0 | 42.0 | 19.9 | 107.9 | 127.8 | |
Allied Health 1200 (Online) | 2 | 33 | 16.50 | 97.32 | 48.66 | 3.21 | 9 | 12 | 43% | 57% | 42.2 | 55.1 | 20.0 | 117.9 | 137.9 | |
Accounting 0500 (Online) | 1 | 29 | 29.00 | 116.12 | 116.12 | 3.76 | 3 | 0 | 100% | 0% | 116.1 | 0.0 | 54.9 | 0.0 | 54.9 | |
Comp Sci & Info Sys 0700 (Online) | 16 | 286 | 17.88 | 635.87 | 39.74 | 20.59 | 68 | 38 | 64% | 36% | 407.9 | 228.0 | 192.9 | 389.8 | 582.7 | |
Digital Media (Online) | 2 | 66 | 33.00 | 0.00 | 0.00 | 0.00 | 0 | 0 | 0% | 0% | ||||||
Economics 2200 (Online) | 4 | 85 | 21.25 | 255.09 | 63.77 | 8.26 | 16 | 0 | 100% | 0% | 255.1 | 0.0 | 120.7 | 0.0 | 120.7 | |
Management/Marketing 0500 (Online) | 1 | 29 | 29.00 | 84.00 | 84.00 | 2.72 | 3 | 0 | 100% | 0% | 84.0 | 0.0 | 39.7 | 0.0 | 39.7 | |
Child Development 1300 (Online) | 4 | 73 | 18.25 | 218.96 | 54.74 | 7.09 | 14 | 4 | 78% | 22% | 183.9 | 48.7 | 78.9 | 0.0 | 78.9 | |
32 | 670 | 1,614.26 | 52.33 | 329 | 63 | 84% | ||||||||||
Online Non Credit | ||||||||||||||||
Allied Health 4930 (Online) | 1 | 105 | 105.00 | 197.03 | 197.03 | 4.05 | 4 | 0 | 100% | 0% | 197.0 | 0.0 | 84.5 | 0.0 | 84.5 | |
Guidance 4930 (Online) | 1 | 76 | 76.00 | 2.47 | 2.47 | 0.08 | 2 | 0 | 100% | 0% | 2.5 | 0.0 | 1.1 | 0.0 | 1.1 | |
Library 1600 (Online) | 9 | 3,999 | 444.33 | 119.51 | 13.28 | 3.87 | 65 | 3 | 96% | 4% | 114.2 | 5.3 | 49.0 | 7.9 | 56.9 | |
Total | 11 | 4,180 | 380.00 | 319.01 | 29.00 | 50.22 | 67 | 3 | 96% | 4% | 116.7 | 5.3 | 50.1 | 7.9 | 58.0 |
Source: Gavilan College Office of Institutional Effectiveness, analysis by Cambridge West Partnership, LLC
179
Gavilan College Open Spaces Near Duck Pond
The following table projects future WSCH and FTES in the benchmark years of 2020, 2025, and 2030. The forecast is in summary form by divisions. A detailed projection by disciplines of the College is provided in Appendix X. Both this summary and the detailed projections include the online offerings.
Table 57: Gavilan College, WSCH Projections by Division 2015-2030
Liberal Arts & Sciences | 32,289 | 37,508 | 43,190 | 50,048 |
Career & Technical Education | 12,474 | 14,458 | 16,716 | 18,935 |
Kinesiology | 4,148 | 4,808 | 5,559 | 6,430 |
Counseling/Guidance | 535 | 620 | 716 | 829 |
Disability Resource Center | 2,078 | 2,408 | 2,784 | 3,221 |
Non-Credit | 576 | 670 | 775 | 870 |
Subtotal 52,100 60,472 69,740 80,333
Off Campus/Apprentice/JFT/JLT | 5,182 | 4,575 | 5,301 | 6,146 |
(apprentice removed after 2015)
Subtotal 57,282 65,047 75,041 86,479
Hollister Satellite | 3,266 | 3,660 | 4,137 | 4,887 |
Morgan Hill Satellite | 3,497 | 3,846 | 4,614 | 5,245 |
Subtotal | 6,763 | 7,507 | 8,751 | 10,132 |
Grand Total | 116,145 | 133,025 | 153,531 | 176,945 |
Main Campus & Satellites | 58,863 | 67,978 | 78,490 | 90,465 |
Source: Gavilan College Office of Institutional Effectiveness, analysis by Cambridge West Partnership, LLC
State standards for construction and renovation of facilities basically focus on capacity. Capacity, as discussed in the Facilities Planning Manual, is correlated with the production of WSCH. WSCH represents the average number of hours of student instruction in a week per class, i.e., 30 students enrolled in a class that meets 3 hours per week is 90 WSCH. This WSCH is then transformed into instructional space or assignable square feet (ASF). Each WSCH type, lecture vs. laboratory, generates an “appropriate” instructional facility addressed as ASF. While these calculations are established through State standards, other factors are considered in planning facilities. An additional factor in all facility planning is adequacy. Adequacy in this context considers both sufficient and suitable capacity to provide for an effective learning environment.
As assessment of the current facilities includes the capacity of the facilities to meet instructional programmatic needs, it reviews the condition of facilities and it addresses their adequacy to provide for an effective learning environment. The WSCH and space projections are not intended to dictate curricular content but rather to provide a perspective of what the current curriculum would look like if extended forward. The most important outcome of the forecasting process is to ensure that when a certain level of WSCH is achieved, the College will have in place designated and/or newly constructed facilities to meet demands of both academic and support services.
Two things result directly from this declaration. One is the need for a very detailed assessment of space needs for growth. Second is the opportunity to plan for facilities that may better serve the instructional and support services programs at the College. It is an opportunity for overall improvement of services at the College.
The current comprehensive analysis of projected space needs, by discipline, can be found in Appendix Y of this EMP. The following table provides a summary of projected space needs. The campus may also need renovations and adjustments to existing space to make areas more suitable for the delivery of services and instruction. The analysis takes into account the current and planned capital construction and applies the State’s space standards to the projected WSCH.
Table 58: Gavilan College Room and Space Allocations Projections by Division 2015-2030
![]()
CURRENT
2015
PROJECTED 2020
2025
2030
Classes taught off the campus in the community and through distance education were excluded from this analysis.
Lec | Lab | Other | Total | # of | Lec | Lab | Total | # of | Lec | Lab | Total | # of | Lec | Lab | Total | # of | Lec | Lab | Total | |
Division | ASF | ASF | ASF | ASF | SEC | ASF | ASF | ASF | SEC | ASF | ASF | ASF | SEC | ASF | ASF | ASF | SEC | ASF | ASF | ASF |
Liberal Arts & Sciences | 14,688 | 21,935 | 8,128 | 44,751 | 279 | 12,280 | 14,856 | 27,136 | 289 | 14,299 | 17,110 | 31,409 | 332 | 16,538 | 19,471 | 36,008 | 386 | 19,156 | 22,608 | 41,763 |
CTE | 2,891 | 22,893 | 584 | 26,368 | 97 | 2,568 | 9,797 | 12,365 | 79 | 3,109 | 11,096 | 14,205 | 94 | 3,595 | 12,829 | 16,423 | 108 | 4,158 | 14,840 | 18,998 |
CTE Other | 0 | 6,535 | 2,221 | 8,756 | 21 | 606 | 8,215 | 8,821 | 18 | 773 | 4,844 | 5,616 | 21 | 894 | 5,600 | 6,493 | 24 | 1,034 | 6,477 | 7,511 |
Kinesiology | 0 | 0 | 0 | 0 | 34 | 114 | 12,460 | 12,574 | 41 | 146 | 14,441 | 14,587 | 47 | 169 | 16,696 | 16,865 | 54 | 195 | 19,313 | 19,508 |
Counseling/Guidance | 0 | 0 | 697 | 697 | 25 | 229 | 0 | 229 | 28 | 293 | 139 | 432 | 33 | 339 | 0 | 339 | 38 | 392 | 0 | 392 |
Disability Resource Center | 0 | 0 | 1,253 | 1,253 | 34 | 826 | 491 | 1,317 | 36 | 1,061 | 424 | 1,485 | 42 | 1,227 | 490 | 1,716 | 49 | 1,419 | 566 | 1,985 |
Total Credit 17,579 51,363 12,883 81,825 490 16,623 45,818 62,441 491 19,682 48,053 67,734 569 22,760 55,085 77,845 659 26,354 63,804 90,158
Non Credit | 0 | 0 | 0 | 0 | 15 | 145 | 356 | 501 | 14 | 186 | 416 | 603 | 16 | 216 | 481 | 697 | 18 | 238 | 555 | 793 |
Cambridge West Partnership, LLC
Satellites
Morgan Hill | 4,726 | 1,879 | 0 | 6,605 |
Hollister | 3,378 | 1,734 | 0 | 5,112 |
Grand Total | 25,683 | 54,976 | 12,883 | 93,542 | 505 | 16,768 | 46,174 | 62,942 | 505 | 19,868 | 48,469 | 68,337 | 585 | 22,976 | 55,566 | 78,542 | 677 | 26,592 | 64,359 | 90,950 |
Source: Cambridge West Partnership, LLC
182
Gavilan College Theater and Language Arts Area
The planning process relied heavily on questionnaire responses and follow up interviews with groups and individuals associated with the academic programs and student support services of the College. The results and findings from these inputs provided the foundation upon which the EMP was constructed. The following groups and individuals contributed to this document.
Board of Trustees
Jonathan Brusco, Member- Morgan Hill
Kent Child, Member- Hollister
Iris Cueto, Student Trustee
Mark Dover, Vice President- Gilroy
Walt Gines, Member- Gilroy
Lois Locci, Ed D., Clerk- Hollister
Rachel Perez, newly elected member
Laura Perry, Esq., President- Morgan Hill
President’s Cabinet
Kathleen A. Rose, Superintendent-President
Michele Bresso, Vice President Academic Affairs
Kathleen Moberg, Vice President Student Services
Frederick E. Harris, Vice President Administrative Services
Eric Ramones, Director Human Resources
Project Steering Committee
Douglas Achterman, Library
Marisol Arredondo, Student
Linda Bernabe, Instructional Site Director, Morgan Hill Center
Randy Brown, Co-Chair- Associate Dean, Community Development/Non- Credit/Adult Education, Grants Management
Mohua Chatterjee, Research Analyst
Carina Cisneros, Associate Dean EOPS/CalWORKS
John Lawton-Haehi, Theater Arts
Sabrina Lawrence, Distance Learning
Noemi Naranjo, Public Information Office
Peter Wruck, Co-Chair- Director, Office of Institutional Research
Kick Off Open House Meeting
Noemi Naranjo, Public Information Office
Peter Wruck, Co-Chair- Director, Office of Institutional Research
Randy Brown, Co-Chair- Associate Dean, Community Development/Non- Credit/Adult Education, Grants Management
Kyle Billups, Assistant Director, Management Information Services
Ron Hannon, Dean Kinesiology and Athletics
Marisol Arredondo, Student
Eduardo Cervantes, Coordinator, MESA/TRiO
Fran Lozano, Dean Liberal Arts & Sciences
Brook Boeding, Interim Associate Dean, Disability Resource Center
Kathleen A. Rose, Superintendent-President
Wade Ellis, Director, Business Services
Eric Ramones, Director Human Resources
Kathleen Moberg, Vice President Student Services
Carina Cisneros, Associate Dean EOPS/CalWORKS
Linda Bernabe, Instructional Site Director, Morgan Hill Center
Student Services Team
Carina Cisneros, EOPS
Susan Sweeney, CalWORKS/Fresh Success
Eduardo Cervantes, MESA/TRiO
Brooke Boeding, Disability Resource Center, Veterans Resource Center
Veronica Martinez, Enrollment Services/SSSP
Candice Whitney, Admissions and Records
Kathleen Moberg, Vice President for Student Services
Academic Senate
Arturo Rosette, President, Art
Marc Turetzky, Political Science
Neal Andrade, Kinesiology & Athletics
Sabrina Lawrence, Distance learning
Blanca Artega, Counseling
Patricia Hendrickson, Child Development/Ed Studies
Ellen Venable, Business/CSIS
Sejal Dharia, Mathematics
Leslie Tenney, Counseling
Jane Maringer-Cantu, Disabilities Resource Center
Jessica Hooper, English
Linda Stubblefield, Allied Health
Douglas Achterman, Library
Gary Cribb, Technology/Public Services
A Arid
Juan Esteban Talavera, MESA
Administrative Services Team
Fred Harris, Vice President Administrative Services
Jan Bernstein Chargin, Director of Public Information
Wade Ellis, Director of Business Services
Kyle Billups, Assistant Director Management Information Services
Jeff Gopp, Director of Facilities
Associated Student Government Leadership
Iris Cueto, Student Trustee
Blanca Arteaga, ASBC Advisor
Omar Lopez, Vice President of Clubs
Jesus Quezada, Vice President of Finance
Taha Khan, Student
Marisol Arredondo, Student
Briana Stauble, Vice President of Activities
Adam Lopez, Vice President of Marketing
Rebecca Kinman, Vice President of Technology
David Didenti, Region IV Representative
Math-Science Instructional Group
Ken Wagman, Math
Maria Dresch-Butler, Math
Jennifer Nari, Math
Health and Education Instructional Group
Patricia Henrickson, Child Development Chair
Debbie Amaro, Allied Health Chair
Industrial Technology Instructional Group
Herb Spenner, Aviation Maintenance
Business, Commerce, Public Safety Instructional Group
Julian Kearns, Economics
Ellen Venable, CSIS
Gilbert Ramirez, Cosmetology
Fine Arts and Humanities Instructional Group
Deborah Gustlin, Art History
Jane Rekedal, Fine Arts Chair
Jan Jars, Journalism
Cherise Martin, Theater Arts
Grant Richards, Film
Andrew Delunas, Philosophy
Language Arts Instructional Group
Mary Ann Sanidad, ESL
Scott Sandler, English
Kathleen Campbell, ESL
Nichole Cisneros, ESL Chair
Karen Warren, English
Bea Lawn, ESL
Social Science Instructional Group
Debbie Klein, Anthropology/Social Science Co-chair
Enrique Luna, History/Social Science Co-chair
Distance Education and Library Instructional Group
Sabrina Lawrence, Distance Education Coordinator
Douglas Achterman, Library
Athletics and Kinesiology Instructional Group
Darlene Del Carmen, Kinesiology Counselor
Nikki Dequin, Kinesiology/Athletics Chair
Mike Dovenberg, Kinesiology/Athletics
Diane Stone, Division Assistant
John Lango, Kinesiology/Athletics
Counseling and Disability Services Instructional Group
Debbie Christensen, Guidance
Simone Reyes, Guidance
Leticia Palacios, Guidance
Rosa Rivera Sharboneau, Guidance Chair
Brooke Boeding, Interim Associate Dean, Disability Resource Center
Blanca Arteaga, Guidance
Jane Maringer-Cantu, Disability Resource Center
Noncredit and Community Education Instructional Group
Randy Brown, Associate Dean of Community Development, Grants Management, and Noncredit/Adult Education
Susan Sweeney, Director of Community Education
Gavilan College Physical Education Area
College Location | City | Time* | Miles* | Route |
Gavilan | Gilroy |
Cabrillo | Aptos | 48 min. | 38 | CA 1 & US 101 |
Hartnell | Salinas | 36 min. | 29 | US 101 |
Evergreen Valley | San Jose | 40 min. | 39 | CA 85 & US 101 |
West Valley | Saratoga | 38 min. | 32 | US 101 |
De Anza | Cupertino | 42 min. | 42 | CA 85 & US 101 |
Merced | Los Banos | 52 min. | 46 | CA 152 |
Gavilan Morgan Hill
Cabrillo | Aptos | 57 min. | 34 | CA 1 & CA 152 |
Hartnell | Salinas | 44 min. | 40 | US 101 |
Evergreen Valley | San Jose | 28 min. | 20 | US 101 |
West Valley | Saratoga | 30 min. | 27 | CA 85 & US 101 |
De Anza | Cupertino | 32 min. | 30 | CA 85 & US 101 |
Gavilan Hollister
Cabrillo | Aptos | 48 min. | 38 | CA 1 |
Hartnell | Salinas | 36 min. | 39 | US 101 & CA 156 |
Evergreen Valley | San Jose | 52 min. | 44 | US 101 & CA 25 |
West Valley | Saratoga | 54 min. | 51 | CA 85 & US 101 |
De Anza | Cupertino | 57 min. | 54 | CA 85 & US 101 |
Merced | Los Banos | 43 min. | 42 | CA 152 & 156 |
*Google Maps distances and times without traffic
Cambridge West Partnership, LLC
These industry sectors produce goods, many of which can be exported out of the region, bringing new dollars into the regional economy. The group includes: farm, forestry, and fishing; mining, logging and oil and gas exploration and extraction; construction; and manufacturing.
These industry sectors produces services, many of which support businesses outside of the region, and therefore bring new dollars into the regional economy. The group includes: wholesale trade transportation and warehousing, and utilities; administration and support, and waste management and remediation services.
This group of industry sectors is comprised of many businesses that operate in offices and often the jobs require higher education degrees. These sectors are a mix of base services-producing firms and local-serving firms. The group includes: information; finance and insurance; professional, scientific and technical services, and management of companies and enterprises.
This group includes only two sectors: education; and health care and social services. While these are local-serving entities the two sectors are commonly separated because the entities are usually accountable to local, state and federal standards that control many aspects of how they operate, expand the scope of operations, and grow. Revenue for entities in these sectors also flows, in part, from outside the region. The two sectors are local serving in that they provide services to residents in the neighborhoods, communities, and regions in which they are located.
188
The industry sectors in this group primarily serve residents and businesses in nearby neighborhoods and local communities in the region. In contrast to the goods-producing or base services-producing group of industry sectors, firms in the local-service sectors tend to recirculate dollars already existing in the regional economy. The group includes: real estate, and rental and leasing; arts, entertainment, and recreation; accommodation and food services; other services; and government.
1990-2015 | Annual | ||||||
1990 | 1995 | 2000 | 2005 | 2010 | 2015 | % Chanage | % Change |
Farm | 4,900 | 4,500 | 5,000 | 3,900 | 3,500 | 3,600 | -26.5% | -1.1% |
Mining and Logging | 300 | 200 | 400 | 200 | 200 | 200 | -33.3% | -1.3% |
Construction | 28,800 | 29,300 | 48,100 | 42,700 | 31,400 | 42,100 | 46.2% | 1.8% |
Manufacturing | 252,600 | 225,800 | 248,600 | 161,200 | 149,000 | 159,400 | -36.9% | -1.5% |
Information | 21,400 | 25,000 | 43,200 | 36,000 | 46,400 | 74,700 | 249.1% | 10.0% |
Financial Activities | 33,000 | 30,600 | 33,900 | 35,800 | 30,800 | 35,000 | 6.1% | 0.2% |
Professional & Business Services | 112,100 | 146,300 | 228,400 | 165,100 | 160,200 | 214,900 | 91.7% | 3.7% |
Educational & Health Services | 72,600 | 78,800 | 86,900 | 104,200 | 126,000 | 155,400 | 114.0% | 4.6% |
Leisure & Hospitality | 58,000 | 61,400 | 71,500 | 71,400 | 73,800 | 94,500 | 62.9% | 2.5% |
Other Services | 22,800 | 24,800 | 26,700 | 24,200 | 23,900 | 26,700 | 17.1% | 0.7% |
Government | 91,000 | 89,200 | 95,900 | 92,900 | 91,500 | 89,900 | -1.2% | 0.0% |
Cambridge West Partnership, LLC
Totals 697,500 715,900 888,600 737,600 736,700 896,400 28.5% 1.1%
Civilian Labor Force | 852,300 | 859,600 | 941,500 | 815,400 | 926,500 | 1,018,400 | 19.5% | 0.8% |
Civilian Employment | 818,600 | 817,500 | 912,200 | 772,000 | 830,100 | 976,100 | 19.2% | 0.8% |
Civilian Unemployment | 33,800 | 42,100 | 29,300 | 43,300 | 96,400 | 42,300 | 25.1% | 1.0% |
Civilian Unemployment Rate | 4.0% | 4.9% | 3.1% | 5.3% | 10.4% | 4.2% | ||
CA Civilian Unemployment Rate | 5.8% | 7.9% | 4.9% | 5.4% | 12.2% | 6.2% | ||
Difference -1.8% -3.0% -1.8% -0.1% -1.8% -2.1%
189
Source: Employment Development Department. Retrieved October 30, 2016 from http://www.labormarketinfo.edd.ca.gov/county/sbenito.html#IND; analysis by Cambridge West Partnership, LLC
1990-2015 | Annual | ||||||
1990 | 1995 | 2000 | 2005 | 2010 | 2015 | % Chanage | % Change |
Farm | 2,800 | 2,500 | 1,900 | 2,500 | 1,600 | 1,800 | -35.7% | -1.4% |
Mining and Logging | 0 | 0 | 0 | 0 | 0 | 0 | ||
Construction | 700 | 700 | 1,400 | 1,800 | 800 | 1,100 | 57.1% | 2.3% |
Manufacturing | 2,000 | 1,600 | 2,500 | 2,900 | 2,500 | 2,200 | 10.0% | 0.4% |
Trade, Transportation & Utilities | 1,700 | 1,500 | 2,900 | 2,500 | 2,700 | 3,500 | 105.9% | 4.2% |
Information | 0 | 100 | 100 | 100 | 100 | 100 | 0.0% | 0.0% |
Financial Activities | 300 | 300 | 400 | 300 | 300 | 400 | 33.3% | 1.3% |
Professional & Business Services | 600 | 600 | 500 | 600 | 700 | 1,100 | 83.3% | 3.3% |
Educational & Health Services | 300 | 700 | 800 | 900 | 1,100 | 1,400 | 366.7% | 14.7% |
Leisure & Hospitality | 700 | 1,000 | 1,400 | 1,400 | 1,100 | 1,300 | 85.7% | 3.4% |
Other Services | 200 | 300 | 300 | 400 | 400 | 400 | 100.0% | 4.0% |
Government | 2,000 | 2,200 | 2,800 | 3,000 | 3,000 | 2,900 | 45.0% | 1.8% |
Cambridge West Partnership, LLC
Totals 11,300 11,500 15,000 16,400 14,300 16,200 43.4% 1.7%
Civilian Labor Force | 20,900 | 22,900 | 27,500 | 24,500 | 27,900 | 29,800 | 42.6% | 1.7% |
Civilian Employment | 18,400 | 19,800 | 25,800 | 22,500 | 23,700 | 27,500 | 49.5% | 2.0% |
Civilian Unemployment | 2,600 | 3,100 | 1,700 | 2,000 | 4,200 | 2,300 | -11.5% | -0.5% |
County Civilian Unemployment Rate | 12.2% | 13.6% | 6.0% | 8.1% | 15.1% | 7.6% | ||
CA Civilian Unemployment Rate | 5.8% | 7.9% | 4.9% | 5.4% | 12.2% | 6.2% | ||
Difference 6.4% 5.7% 1.1% 2.7% 2.9% 1.4%
190
Source: Employment Development Department. Retrieved October 30, 2016 from http://www.labormarketinfo.edd.ca.gov/county/sbenito.html#IND; analysis by Cambridge West Partnership, LLC
Degrees Certificates
Program Title AA AS AD-T Achievement Proficiency
Anthropology | X | ||||
Art: Studio Arts | X | X | |||
Business Administration | X | ||||
Business, General | X | ||||
Business: Accounting | X | ||||
Business: Accounting | X | ||||
Business: Computerized Accounting | X | ||||
Business: Economics | X | ||||
Business: Economics | X | ||||
Business: General Office Skills | X | ||||
Business: General Office Skills | X | ||||
Business: Medical Office | X | ||||
Business: Medical Office | X | ||||
Business: Retail Management (WAFC) | X | ||||
Business: Retail Management (WAFC) | X | ||||
CGD: Advanced Technical Computer Graphics | X | ||||
CGD: Advanced Technical Computer Graphics | X | ||||
CGD: Environmental Design | X | ||||
CGD: Environmental Design | X | ||||
CGD: Technical Desktop Publishing and Graphics | X | ||||
CGD: Technical Desktop Publishing and Graphics | X | ||||
Child Development | X | ||||
Child Development and Educational Studies | X | ||||
Child Development: Early Childhood Education | X | ||||
Child Development: Early Intervention Assistant | X | ||||
Child Development: Family Child Care | X | ||||
Child Development: School Age Child Care | X | ||||
Child Development: Spanish Early Childhood Education | X | ||||
CSIS: Business Computer Applications | X | ||||
CSIS: Business Computer Applications | X | ||||
CSIS: Computer Hardware | X | ||||
CSIS: Computer Networking | X | ||||
CSIS: Computer Networking | X | ||||
CSIS: Computer Networking | X | ||||
CSIS: Computer Programming | X | ||||
CSIS: Computer Programming | X | ||||
CSIS: Computer Science & Information Systems | X | ||||
CSIS: Programming for the Internet | X | ||||
CSIS: Programming for the Internet | X |
Degrees Certificates
Program Title AA AS AD-T Achievement Proficiency
CSIS: Scientific Programming | X | ||||
CSIS: Scientific Programming | X | ||||
CSIS: UNIX Operating Systems | X | ||||
CSIS: UNIX Operating Systems | X | ||||
CSU General Education | X | ||||
DM: Digital Design and Imaging | X | ||||
DM: Digital Imaging-Graphic Production Specialist | X | ||||
DM: Digital Media | X | ||||
DM: Digital Print Production Specialist | X | ||||
DM: Digital Video and Animation | X | X | |||
DM: Digital Video Editor Specialist | X | ||||
DM: Interactive Media and Authoring | X | X | |||
DM: Web Page Production Specialist | X | ||||
Economics | X | ||||
English | X | ||||
IGETC | X | ||||
Liberal Arts: Business | X | ||||
Liberal Arts: Computer Science & Information Systems | X | ||||
Liberal Arts: Elementary Education | X | ||||
Liberal Arts: Expressive Arts | X | ||||
Liberal Arts: Language Arts & Humanities | X | ||||
Liberal Arts: Multiple Subjects | X | ||||
Liberal Arts: Social Science-Behavioral & Organizational | X | ||||
Liberal Arts: Social Science-Cultural & Historical | X | ||||
Political Science | X | ||||
Social Science: Community Studies | X | ||||
Social Science: Community Studies | X | ||||
Social Science: Global Studies | X | ||||
Spanish | X | ||||
Spanish Native Speakers 4 | X | ||||
Spanish Native Speakers 4 | X | ||||
Spanish Non-Native Speakers 1 | X | ||||
Spanish Non-Native Speakers 1 | X | ||||
Spanish Non-Native Speakers 2 | X | ||||
Spanish Non-Native Speakers 2 | X | ||||
Spanish Non-Native Speakers 3 | X | ||||
Spanish Non-Native Speakers 3 | X |
Totals 25 12 9 31 9
Source: Gavilan College. Substantive Change Proposal. November 2015
Service Area and Services | Notes |
Admissions& Records
Various printable forms - Students can print forms and submit in person, by mail, email or FAX |
|
http://www.gavilan.edu/admit/documents/StatementofFinancialS upport_2016_2017_0616.pdf | |
Service Area & Services | Notes |
Assessment Practice tests and test uides Testing schedule |
High School testing information http://www.gavilan.edu/admit/assessment/schedule_hs.php |
Career/ Transfer Center
|
![]()
![]()
Service Area & Services | Notes |
Counseling |
http://www.gavilan.edu/counseling/documents/PrereqVerificationFo rm.pdf |
Service Area & Services | Notes |
Disability Support Services Basic information - Application forms Request for Media Agency links Faculty/Staff information |
|
Veterans Information and forms available Resource information available | |
Bookstore Follett has various items on-line, but not through Gavilan. Link re-directs to Follett website. Gavilan items can be ordered here. |
|
Service Area & Services | Notes |
Equal Opportunity Programs & Services (EOPS)/CARE/CalWORKS
|
|
Service Area & Services | Notes |
Financial Aid & Scholarships |
|
Service Area & Services | Notes | |
Financial Aid & Scholarships (continued) |
| |
Service Area & Services | Notes |
ASGC/Student Life Basic information (ASG, Clubs, Calendar of Events) |
W-9 Request for Taxpayer Identification Number & Certification
|
Service Area & Services | Notes |
Student Health Services Online Inquiries Comprehensive Overview Drug Free Schools StudentHealth101-onlinemagazine Student Mental Health Program-Students at Risk, Veterans, and LGBTQ Sexual Assault Prevention Training- Not Anymore Resources in Santa Clara County Resources in San Benito Suicide Crisis Intervention Wellness Tools |
|
Service Area & Services | Notes |
Student Health Services (continued) |
Source: Gavilan College. Student Services, 2017
TRiO Student Support Services Grant Summary
In August 2015 the College was awarded a five-year renewal of the TRiO Student Support Services grant. The programs and services supported by the grant assist first- generation, low-income, and/or students with disabilities as they pursue an associate degree and/or transfer.
TRiO Grant Services
Specialized academic counseling and guidance | Career and personal development |
Priority registration | Summer Bridge program |
TRiO financial grants | Laptop and calculator loans |
Financial aid application assistance | University campus visits |
Informational workshops | Cultural activities |
Mathematics, Engineering, Science Achievement (MESA) Grant Summary
The California MESA program is supported by grant funds from the Chancellor’s Office that are annually renewable based upon performance of the program at each college. This program provides academic development to educationally disadvantaged community college students so they will excel and transfer to four-year institutions in calculus-based majors in science, technology, engineering, and math (STEM) disciplines. Services include academic excellence workshops and tutoring, advising, a study center, transfer assistance, and career development activities.
Basic Skills Grant Plan Summary
In spring 2016, the College submitted its Community Colleges Basic Skills and Student Outcomes Transformation Program plan, which outlines the College’s previous initiatives to address Basic Skills education, and establishes three goals for the program’s future.
27% of Gavilan students—around 1,500—are enrolled in Basic Skills courses. Persistence through and completion of these courses is a major problem for many of these students, who often terminate their course track before ever reaching transfer-level courses.
Current Practices
The following is a list of previous initiatives, programs, and services the College has employed to further the basic skills success of its students:
Establishment of a Basic Skills committee, which set tutoring, counseling, and professional development as the cornerstones of the Basic Skills program.
Hiring of a dedicated basic skills counselor.
Workshops to cover life skills, college competencies, and academic preparedness.
Professional development opportunities for faculty, including on campus events, Focused Inquiry Groups, and 3CSN workshops.
Attachment of tutors and counselors to the classroom to provide academic support.
Course development and curriculum modifications in ESL (VESL), Math (immersion) and English (integrated reading and writing).
Metacognitive strategies (Habits of Mind, Mindset) and academic strategies (Integrated Reading and Writing, Reading Across the Curriculum, Acceleration) adapted to and implemented in Gavilan College structure and classroom work.
Augmented efforts through joint initiatives with Department of Education awards in STEM and Title V.
e.g. expanded tutoring through supplemental instruction, and early alert program
Integration between SSSP, Equity, and Basic Skills efforts.
e.g. Welcome Center peer mentor program, Basic Skills Retention Specialist, Learning Commons instruction and academic support center.
Three areas have shown great promise for success in their early stages of implementation, and are the basis for the future goals of the Basic Skills Program.
Offering of pre-assessment boot camps, which have proven successful in placing students higher.
Support services, including supplemental instruction, peer mentoring, social- emotional learning support, in guiding students through basic skills courses.
Piloting of accelerated basic skills courses, which have demonstrated higher success and persistence rates of basic skills students.
Future Goals
The Basic Skills Program sets forth several goals that center around three courses of action: 1. Place more students into higher level, gateway transfer English and math courses, 2. Increase progression rates through basic skills courses through strengthened support, and, 3. Shorten pathways to goals through course acceleration. These goals and their component activities and actions are summarized in the tables below.
Place more students into higher level, gateway transfer English and Math courses | |
Activities/Actions | Outcomes |
Provide assessment testing for high school juniors | Increase number of students assessed by 2,365 annually |
Train high school teachers for boot camp instruction | Six additional trained instructors |
Offer more boot camps | Six additional boot camps to serve 180 students. |
Increase progression rates through basic skills courses through strengthened support | |
Activities/Actions | Outcomes |
Integrate a Basic Skills counselor into classroom instruction | Basic skills counselors will participate in orientation, hold one workshop, and have two appointments with each student in five accelerated classes each semester. |
Provide supplemental instruction in Math | 25 students will be trained in supplemental instruction and placed in classrooms. |
Provide textbooks in 10 key gateway classes | 200 level math and English textbooks distributed to five classes each semester. |
204
Provide 15 student and staff mentors | Fifteen mentors trained and assigned to two students each semester |
Provide instructional program specialist for support with pre-transfer English students, especially those with second language issues. | Hiring of specialist |
Provide instructional staff with training on social and emotional learning techniques. | Trainer is sent to conference and holds four workshops for 10 faculty members. |
Shorten pathways to goals through course acceleration | |
Activities/Actions | Outcomes |
Increase sections of acceleration model pre- transfer level English and math courses | Add two classes in English and Math each year. |
Provide training on acceleration | Four workshops for 10 faculty members. |
Student Equity Grant Plan Summary
In December 2014, Gavilan College updated its Student Equity Plan. To do so, a committee of faculty, staff, administrators, and students collaborated with the Office of Institutional Research (OIR) to research the current state of equity at the College, discuss issues, and propose solutions for subsequent years. Their findings are summarized below.
In accordance with the California Community College Chancellor’s Office’s Student Equity Guidelines, the committee and OIR explored inequity at the college across five indicator areas: 1. Access, 2. Course Completion, 3. ESL and Basic Skills Completion, 4. Degree and Certificate Completion, and 5. Transfer. Significant levels of inequity were found only in two of the five indicator areas, Course Completion, with Low-income Students and Foster Youth showing inequitable rates, and Transfer, with students that were Hispanic, Disabled, or 20 years and older as inequitable. Other groups demonstrated inequity in other indicator areas, but the OIR and the student equity committee, either due to having a small sample size or being unrealistic, deemed these insignificant. These findings are displayed in Table 1 below (an “X” indicates significant inequity, while asterisks indicate insignificant inequity).
Inequity at Gavilan College across Six Indicator Areas
Group Showing Inequity | Access | Course Completion | ESL and Basic Skills Completion | Degree and Certificate Completion | Transfer |
Low income | X | ||||
Non-low income | ** | ||||
Foster Youth | X | ||||
Hispanic | X | ||||
Asian | * | * | |||
Native American/ American Indian | * | * | |||
Multi-ethnic | *** | ||||
Disabled | X | ||||
< 20 years old | *** | ||||
20 – 24 years old | ** | X | |||
25 – 49 years old | * | X | |||
50 + years old | ** | * | * | ||
Unknown Gender | * |
*: Small sample size and likely unreliable
**: Not a realistic inequity
***: Measured differently in service area than at Gavilan College
To alleviate the demonstrated areas of inequity at the College, the Gavilan student equity committee proposed several goals and initiated corresponding programs and activities in the indicator areas of Course Completion and Transfer.
Course Completion
The first and most significant goal in this area is to “reduce the difference between low income and average student course completion rate by 2% points annually through AY 2016/2017.” To achieve this goal the Equity Plan initiates various activities, each tethered to a program or service the College offers85:
“EOPS/CARE:
Provide and market Student Success Workshops for EOPS and CARE students.
Provide orientations, complete abbreviated and comprehensive education plans the first semester; monitor progress through progress reports and develop success plans, assist with purchase of textbooks and deliver follow-up services.
CalWORKs
![]()
85 Gavilan College, Student Equity Plan. December 9, 2014
Evaluate the effects of the mandatory class/orientation on CalWORKs’ students.
Provide counseling and supportive services to prepare CalWORKs students for enrollment.
TRIO
Pilot a Math boot camp course and summer bridge program summer 2014
MESA
Conduct student networking mini conference with student success and life skills training.
Financial Aid
Collaborate with Counseling Department to ensure that all students on financial aid complete education plans.
Develop or identify financial literacy training for students who are seeking loans.
Research
Conduct research on SSSP on low income students and course success and the impact of new SSSP requirements
Student Success Center
Partner with Financial Aid, A&R, Assessment, counselors and basic skills instructors to identify low income, basic skills students and market Student Success Center (SSC) services to them.
Plan outreach activities (class visits, Open House, tables on campus, high school visits) to publicize services to low-income students.
Promote SSC’s technology resources (computers, laptops and iPads) to low-income students
Develop a robust workshop schedule that addresses low-income students’ needs on topics such as funding higher education, job search, and transfer options.
Build a borrowing library with textbooks for basic skills classes, literary texts, and other classes.
Basic Skills
Recruit and support low income students
Pilot a workshop requirement for students in Basic Skills English classes on topics of interest to low income, Hispanic, DRC, and older student populations.
Pilot a JumpStart acceleration program in Fall 2014 to increase basic skills progression
Conduct meetings with counselors and instructional staff to collaborate on the expansion of Early Alert.
Counseling
Provide orientation and Guidance Courses, Education Plans, Student Follow-up.
Library
Promote laptop loan program targeting low-income students
Secure additional textbooks for the library reserve program.
Tutoring
Provide tutoring for students 24/7 so they can access tutoring support after hours.
Faculty Development
Train faculty to provide online resources appropriate to mobile devices
Provide training opportunities to faculty on the characteristics and effects of poverty on students.
Train faculty to provide information to students on textbook loan, reserve, purchase and scholarship options.
Supplemental Instruction
Provide supplemental instruction in gateway and high failure rate courses
Basic Support Services
Offer basic need support for students including food, mental health and transportation assistance.”
The second goal in this area is to “reduce the difference in course completion rate between Foster Youth students and the college average by 5% points.” To achieve this goal, the Equity Plan initiates the following activities:
Expand the services of the Foster Youth Advisory Committee by hiring a counselor for part-time foster youth students, to ensure they receive adequate services.
Reach out to foster youth on campus with Social Services and Independent Living Skills Programs, and increase the number of foster youth students in EOPS from 35 to 50.
Transfer
The first goal in this area is to “reduce the difference between Hispanic-American student transfer rate and the college average by 4.5% points.” To achieve this goal, the Equity Plan set forth several activities:
Fix scheduling issues that interfere with students’ educational goals.
Conduct TRIO Summer Bridge math boot camp.
Increase information of and visitations to local universities.
Designate funding, space, software and staff to reestablish Career/Transfer Center.
Begin research on expanding Puente model.
The second goal in the Transfer area is to “reduce the difference in transfer rate between students with disabilities and the college average by 5% points,” which establishes the following activities:
Increase established Disability Resource Center (DRC) counseling hours to offer additional DRC services to disabled students.
Develop pathways for disable students to transfer to universities.
The third goal in this area is to “reduce the difference between student transfer rate for those 20 and older students and the college average by 5% points.” The following activities help achieve this goal:
Provide support services in the evening, off-sites, and weekends.
Fix scheduling issues that interfere with students’ educational goals.
The fourth and final goal in this area is to “reduce the number of Veterans who do not complete 60 transferable units by 5%,” which entails the following activities.
Provide data to track transfer and dropout rates of veterans
Develop pathways for the transition of veteran students to universities.
Student Success and Support Program Plan Summary
In fall 2015, the College submitted its Student Success and Support Program (SSSP) Plan, which outlines the goals it has established for the future and steps it has taken since the previous academic year to increase student success and achievement. The SSSP committee, cooperating with the Student Equity, and Basic Skills committee, constructed the SSSP Plan. With the goal of ensuring student success the committee members engaged in dialogue, research, and planning. There are four core services on which the SSSP Plan is focused: 1. Orientation, 2. Assessment for Course Placement, 3.
Counseling, Advising, Education Planning Services, and 4. Follow-up for At-Risk Students. Most 2015-16 planning is centered on Orientation and Counseling, Advising, Education Planning Services.
Orientation
Significant initiatives undertaken in the 2014-15 year focused on developing a multifaceted pathway process for new student success, which included:
Establishment of a Welcome Center, with peer mentors to assist new students with financial aid, registration, and enrollment.
Kick Start courses, which assist graduating high school students with their transition to Gavilan in understanding enrollment, course options and requirements, assessment, and the MyGav student portal. The course was given a designated classroom and all course material was put online.
First Year seminars, which acquaints new students with College services, programs, requirements, and strategies for success. The seminar was given a designated classroom and all course material was put online.
Student checklist, which tracks students’ requirements and sends email notifications.
The goals, activities, and rationale of SSSP Plan 2015-16 for Orientation are summarized in the following table:
Orientation | |
Activity | Rationale |
Collect early student data on students who did not participate in orientation | To better identify and target this population, and capture it in orientation programs. |
Implement new web management system | Will help the College improve its marketing, outreach and information. |
Update the Kick Start and First Year seminar curriculum. | Will streamline and standardize content, provide more student-centered activities. |
Hire 2 General full-time counselors and 1 | To expand in-person orientation offerings. |
General/Athletics counselor | |
Implement automated student notification system (GradGuru) | To help inform students of services, deadlines, etc. |
Create a global understanding across IT, IR, and all other departments of data sources/collection. | Will result in better and more informed practices. |
Assessment for Course Placement
Significant initiatives from the 2014-15 year were sparse, as the College mostly persisted to place students with its already existing assessment structure. That structure utilizes ACCUPLACER online assessments in tandem with other measures, including student background data, standardized test scores, and counselor interview. Some new initiatives were:
College math faculty began discussing the impact of Common Core on placement with high school partners.
English and math faculty continued work with pre-assessment “boot camp” courses.
Notification of students’ post-assessment of the New Student Checklist.
There were few goals and activities for Assessment put forth in the 2015-16 SSSP Plan:
Assessment for Course Placement | |
Activity | Rationale |
Work with MIS to implement automatic upload of AP scores from college board | Streamline collection of student background data. |
Explore increased usage of Early Assessment Program Scores | |
Counseling, Advising, and Other Education Planning Services
Significant initiatives from the 2014-15 year were numerous, and included:
Increased availability of counseling appointments for Summer 2014.
Counseling services expanded to off-site campuses.
Improved data collection by establishing a common language and coding scheme.
Updated educational planning software to MyDegreeWorks.
Generation of regular student reports.
Automated notifications to students who have not completed required enrollment procedures.
Increasing counseling appointment rotation from 10 to 20 days.
Creation of Student Checklist to keep students up to speed on progress on matriculation requirements.
Creation of Online Change of Major form.
Collaboration between different counseling teams to initiate a campus-wide strategy to reduce the number of students who are undecided, planning to transfer to a different college, need follow-up, and are on financial aid.
The goals, activities, and rationale of SSSP Plan 2015-16 for Counseling are summarized in the following table:
Counseling, Advising, and Other Education Planning Services | |
Activity | Rationale |
Hire additional general counselors. | To expand counseling services. |
Hire additional counseling staff. | Will reduce wait time for general counseling appointments. |
Incentivize student participation in counseling. | |
Collect data on the reason why students did not satisfy matriculation requirements. | To better address issues, strategize interventions. |
Use technology such as automated emails, web page, and mobile apps to better communicate with students. | |
Increase array of counseling services. | Will increase scope of communication with students. |
Increase communication and collaboration with high school staff | To ensure potential College students understand requirements and services of Gavilan. |
Conversion of email counseling services to SARS online system. | Will assist in capturing data. |
Create automatic systems of capturing data on students | Will help identify students who need to complete SSSP requirements. |
Follow-up for At-Risk Students
Significant initiatives in the 2014-15 year focused primarily on moving towards automation and streamlined communication, and included:
Revamping of Gavilan Early Alert System (GEARS) as Early Connect, the notifications for which are not yet fully automated.
Implementing early detection and intervention for students on the 2nd level of academic probation.
Creation of the SSSP Student Checklist (mentioned above) available through the student portal.
Purchase of Grad Guru mobile app, to be implemented in 2016-17, to better notify students.
Following up with students who did not show for counseling meetings.
Revision of Academic Dismissal petitions and Progress reports.
The goals, activities, and rationale of SSSP Plan 2015-16 for Follow-ups for At-Risk Students are summarized in the following table:
Follow-up for At-Risk Students | |
Activity | Rationale |
Explore incentives or disincentives for students who are on Probation 1 or Probation 2 (P1/P2). | To make interventions more meaningful and happen earlier. |
Begin student workshops for P2 students. | Help students build skills and work through challenges that put them on probation. |
Explore dedicated staff to routinely obtain P1/P2 and dismissal reports. | To identify these students earlier and more often. |
Holds to be placed on student records if they fail to connect with their counselors. | |
Non-Credit Student Success and Support Program Grant Plan Summary
The 2015-16 Non-Credit SSSP Plan outlines the approach the College’s non-credit programs take in order to meet their SSSP responsibilities in 1. Orientation, 2.
Assessment and Placement, 3. Counseling, Advising, and Education Planning Services, and 4. Follow-up for At-Risk Students. The plan does not focus on goals or pending initiatives for future years, and rather describes the current state of the services and programs already in place at the College.
Orientation
Orientation activities take place before the start of each term with a series of new non- credit student orientation programs, which present information on the courses, requirements, and services available for non-credit students. The programs include a slide presentation and a Q&A segment. Later, students are assisted with enrollment, assessment, placement, and advising. These orientations are provided both in-group and individual settings. At every orientation, credit ESL program representatives are present to facilitate transition to those students hoping to credit work.
Additional orientation events are available monthly throughout the term, for non-credit students who enroll mid-term. An assessment specialist, hired through SSSP non-credit funds, also provides additional condensed orientation events throughout the year for students unable to attend the initial orientation.
The College partners with local community organizations to share information about orientation with potential non-credit students. The total audience for all orientations throughout the term is approximately 200 students, with most being ESL students.
Assessment and Course Placement
Non-credit students are assessed and placed using the computer-based Comprehensive Adult Student Assessment System (CASAS), known as E-CASAS, and CASAS oral assessment tools. CASAS is designed to measure the real-world basic skills and English language skills of adult learners needed to function and in work and life. The test is comprised of a life-skills appraisal section, an English reading section, and an English oral section. No test preparation services are currently available.
Some basic multiple measures are used in placement, which include students’ ability to qualify for California residency, their location, and time in previous school or experience with English classes. Along with the CASAS score, these measures are used to place students.
Approximately 400 new students, who are primarily English language learners interested in vocational and/or life skills, are assessed each academic year.
Counseling, Advising, and Other Education Planning Services
The non-credit counselor initially establishes connection with non-credit students through a brief conversation at orientation events. Subsequently throughout the term, the non- credit counselor has a regular rotation of visits at each of the 15 community-based non- credit education sites, in which the counselor provides advising and helps non-credit students develop their education plans. Education plans are made using DegreeWorks software. Appointments are not required for these meetings.
Currently, the available hours of non-credit counseling are not adequate at only 10 hours per week. Thus, as part of the Gavilan Regional Adult Career Education Services (GRACES) consortium plan, a full time regional counselor will be hired to serve non- credit students in addition to the population of the entire consortium.
Approximately 1,000 students non-credit students are the audience for these counseling and advising visits. The focus is on the approximately 200 new students each term.
Follow-up Services for At-Risk Students
The non-credit counselor, on regular rotation to non-credit education sites, undertakes follow-up services for the non-credit students. The counselor targets students who have not yet submitted their education plans and meets with these students individually to advise and refer them to planning and support services.
Most of the “at-risk” students are Hispanic and undocumented, and are taking High School English (HSE) or ESL Lifeskills curriculum. Each term, approximately 500 students are classified to be “at-risk.”
Career and Technical Education Earmarked Grant Funds Summary
In the 2014-15 budget the State provided one-time funds for community colleges to enhance their career and technical education programs through curriculum development, equipment purchases, or professional development for faculty and staff. The effort was largely to coordinate alignment of curriculum across the region, develop new curriculum, revise programs, retool/equip some programs, and provide professional development for faculty members.86The College was able to assist these six programs with these funds.
Aviation Maintenance Technology
Child Development
Computer Science and information Systems
![]()
86 Gavilan College. CTE Enhancement Fund Final Report. April 21, 2016
Digital Media
Allied Health Career Occupations Training Programs
Water Resources Management
California Career Pathways funding (SB 70/1070) was used to host a dual enrollment workshop and California Career Pathways Trust Funds (CCPT) resources were used to partner with West Valley College as the local education agency for the water programs focus of those regional efforts. A CTE Transitions grant was focused upon outreach/career exploration, articulation, credit-by-exam, and activities such as visits to the college campus and career days that would to help students become interested in attending college and assist them to migrate from secondary to postsecondary education then into the world of work.
The Vocational Education Training Authority (VETA) or Carl D. Perkins federal grant program is to improve career and technical education (CTE) programs serving special populations and seeking to meet gender equity needs. The funds are awarded to the Chancellor’s Office then passed through to the College based on student population numbers in the CTE programs. The College has devoted these funds to supporting several programs that lead to high paying jobs: (1) Aviation Maintenance, (2) Child Development; (3) Cosmetology; and (4) Certified Nursing Assistant. Support has been used for equipment purchases, professional development, and curriculum revision. These funds cannot replace regular College funding for CTE programs.
Adult Education Block Grant Summary
In 2013-14 the state provided funds for community colleges and adult schools to form consortia and plan for more coordinated delivery of key services to adults in the service area. The College took the leadership roles as fiscal agent and consortium chair for its region. The consortium, named the Academic and Career Education Services (ACES), consists of the College and representatives from the following public school districts: Morgan Hill Unified School District, Gilroy Unified School District, San Benito High School District, Aromas-San Juan School District. In 2015 the Legislature established a mechanism for block grant funding to support the action plans of the consortia.
Evaluate the current levels and types of adult education programs within the region, including education for adults in correctional facilities; credit, non-credit, and enhanced non-credit adult education coursework; and programs funded through Title II of the federal Workforce Investment Act (Adult Education and Family Literacy Act, Public Law 05-220).
Evaluate the current needs for adult education programs within the region.
Create plans for consortium members and partners to integrate existing programs and create seamless transitions into postsecondary education or the workforce.
Create plans to address the gaps identified through goals one and two above.
Create plans to use approaches proven to accelerate student progress toward academic or career goals, such as contextualized basic skills and career technical education.
Develop other joint programming strategies between adult education and career technical education.
Create plans to collaborate in the provision of ongoing professional development opportunities for faculty and other staff to help them achieve greater program integration and improve student outcomes.
Create plans to leverage existing regional structures, including, but not limited to, local workforce investment areas.
A GED Preparation certificate was approved in 2015.
ESL faculty members implemented a Lifeskills and vocational ESL certificate in 2015.
A series of ESL occupational classes have been created to contextualize language learning with the occupational skills. These include: keyboard basics, computer/internet basics, presentation basics, website design basics; excel basics, word processing basics, business (entrepreneur) basics.
A full-time non-credit program counselor has been hired.
In the near future the non-credit program leadership and faculty members plan to create additional career and technical education programs that partner with credit instruction in areas such as welding and hospitality.
The leadership plans to explore seamless connections with county social service programs and workforce investment boards.
Non-credit program leadership plans to explore opportunities with work-placed ESL and Old Adult courses.
More accelerated options in ESL are being explored in family and childcare, horticulture, and entrepreneur.
More non-credit basic skills and CTE courses are being explored.
Were there more staff, the non-credit program leadership would like to explore ways to develop more workforce development efforts in collaboration with local businesses.
The non-credit program leadership is exploring ways to provide workforce education to those incarcerated in the San Benito County jail. This would be part of a transition back to society effort for those who will be released.
Science, Technology, Engineering, Math (STEM) Magnet Improving Pathways for Hispanic/Low-Income Students in Hispanic-Serving Institutions Title III Grant 2011- 2016 Summary
This STEM and articulation co-operative grant with San Jose State University concluded in 2016-17. It had been used to pursue the following major service strategies:
Part 1: STEM Pathways
Create STEM awareness activities as a magnet outreach effort.
Streamline five aligned majors.
Provide faculty professional development for new studio curricula.
Part 2: Increase STEM Support
Develop accelerated basic math sequences.
Retain a STEM counselor to provide case management services.
Create an intensive summer math institute as a practice bridge venue.
Part 3: Strengthen STEM Curriculum
Provide faculty professional development to update and test new instructional methods.
Create hands-on research internship projects.
Re-design and update the engineering curricula.
Introduce a new environmental science major to engage students.
The grant endeavored to accomplish seven objectives.
Increase the number and proportion of Hispanics, women, and others declared as STEM majors.
Increase the percentage of students in cohorts who succeed and persist the next level of basic math through re-designed curriculum.
Increase the percentage of students who succeed in gateway courses using supplemental instruction.
Increase the percentage of students in cohorts who succeed in new studio and other new curriculum pilots.
Increase the percentage of students in summer institute cohorts who succeed and persist the next level of STEM curriculum.
Increase the percentage of STEM majors who complete milestones such as accumulating 12, 30 and 60-transferable units and earn a BA/BS degree.
Close the gaps between Hispanic/White and Women/Men students on all of the above measures.
Science, Technology, Engineering, Math (STEM) Hispanic-Serving Institutions Title III Grant 2016-2021 Summary
In 2015-16 the College assembled the STEM Planning Group to prepare an application for a third STEM grant. The Hispanic Serving Institutions Title III STEM grant for $4.7 million over five years was awarded to the College in November 2016. From over 254 applications, 91 were funded and the College was only one of five applicants with a perfect score of 100. The official name of the grant indicates its major themes- Strengthening Hispanic STEM Students: Comprehensive Support, Guided Pathways, and Renewed Learning. As was the case with the earlier STEM grant, the College is drawing upon an established relationship with faculty members and institutional leaders at San Jose State University (SJSU). SJSU is the largest institution for Gavilan student transfers.
Improve STEM student outcomes by increasing
The number STEM majors to 200 and increase the percentage that are Hispanic/low income/first-generation.
The STEM major transfer rates by 10% and the percentage of those who are Hispanic to 63%.
The number of STEM students completing 30 and 60-unit milestones by 10%.
The completion of STEM BA/BS degrees by 8% (long term data, 4-year partner, SJSU)
Increase guided pathway success expressed in
The number of Guided Pathway students who complete STEM transfer in three years by 10%.
The strength of results on replication of the CUNY Accelerated Study in Associate Programs (ASAP) model to STEM student outcomes.
Increase teaching-learning opportunities by increasing
The number of STEM faculty who pilot inclusive STEM Culture & High Impact Practices to 50.
The number of students in introductory math/science courses who are successful (C or better) by 10% by using supplemental instruction and other interventions.
The number of students in accelerated math and English who are successful (C or better) by 10%.
The grant is designed as one activity with three parts or types of interventions.
Increase the effectiveness of STEM student supports by centralizing and broadening fragmented support services.
Provide students in STEM programs access to equipment at a centralized STEM Support Center.
Provide students in STEM programs access to personal support in the form of a STEM Counselor; academic/career advising, tutors, and faculty mentors. Locate the MESA program staff at the STEM Support Center. Use a case management approach.
Conduct bi-lingual outreach workshops on STEM information and careers to families of STEM major students and to local middle school children.
Provide students in STEM programs access to Summer Bridge (pre-freshmen) and to the Transition Academy (2nd year).
Strengthen STEM pathways to transfer by streamlining degree requirements.
Create new STEM Guided Pathways and streamlined program maps that are articulated with San Jose State University (SJSU).
Create opportunities to participate in the STEM-ASAP study regarding the efficacy of supports and pathways.
Renew STEM teaching & learning opportunities for students and faculty members.
Encourage students and faculty members to participate in inclusive STEM culture and high-impact practices through pilot projects.
For introductory STEM curriculum provide access to accelerated remedial math/English and supplemental instruction.
Provide access to student research internships in STEM projects with SJSU Faculty Supervisors.
Title V Co-operative Grant with Hartnell College, Gavilan College, and California State University at Monterey Bay (2012-2017) Summary
This Title V Co-operative Grant with CSU Monterey Bay (CSUMB) and Hartnell College is concluding in 2017. The co-operative grant focused on Hispanic students interested in career and technical majors in nursing, digital media, and computer science. A summary of the activities/interventions supported by this major grant is found in Appendix Intervention Summaries.
The grant had three shared goals that were collaboratively addressed problems:
Academic Programs: To develop three career and technical education transfer pathways to CSUMB that will increase the transfers and degree completers from both Hartnell and Gavilan.
Institutional Management: To increase the quality and quantity of data available to evaluate and improve the career and technical education pathway and train faculty and students to track student outcomes.
Fiscal Stability: To provide services to more career and technical education transfer pathway students at no additional operating cost and to reduce technology costs with open-source resources.
This grant had six shared measurable objectives to be accomplished by fall 2017
Increase Hispanic career technical education pathway completion rates
At the community colleges by 10% over spring 2012.
At the University BA/BS rates by 10% over spring 2012.
Increase the Hispanic and others’ transfer rate and pace by 20% more student transfers in three years to CSUMB above the fall 2007 cohort baseline.
Increase success rates
In the higher remedial courses, using contextual instruction compared to standard approaches, increase success by 10% over the spring 2012 rate.
Of non-credit ESL students at Gavilan who move into credit programs from the 2010-11 baseline of 12-15 per year to 35 per year.
New teaching approaches will be used by at least 85% of the 50 career and technical education pathway faculty
Increase to 36 the faculty and staff members who routinely use query research to improve project/college programs from the 2011-12 baseline of six faculty and staff.
Reduce the average number of excess units taken in the career and technical education pathway by 50% over the baseline set in year one.
Title V Developing Hispanic-Serving Institution Grant (2015-2020) Summary
The College successfully applied for a federal U.S. Department of Education Title V- Developing Hispanic-Serving Institutions program grant in 2014 and received $2.6 million to be spent over five years. The grant activities address the gap in college transfer and completion that has been noted between Hispanic and non-Hispanic students.
Improve student outcomes for Hispanic and high-need students by increasing
Success rates in key gateway courses by 10% above the baseline of 58.5%.
Student transfer rates overall to 20%.
Hispanic student transfer rates to be in parity with the student body (58%).
The rate of six-year BA/BS completion to 80%.
The number of liberal arts/education majors to 100.
Transfer Academy student completions to 100%.
Improve the access to and quality of online programs by increasing
The success rates in gateway courses to match traditional face-to-face courses (69%).
The positive ratings of the help desk to 90%.
Improve civic engagement education by increasing
The numbers of students participating in civic engagement projects to 450 and the numbers of faculty members participating as mentors to 30.
The number of Civic Leadership Certificates awarded to 30 per year.
Strengthen faculty teaching-learning skills by increasing the number of faculty members engaged in
Accelerated instruction pilot efforts to 30.
Directed learning activity pilots to 50.
Online/hybrid course development to 30.
The Learning Commons facility is the primary venue for services provided through the grant-supported interventions for goal one.
Provide professional development to faculty to support their work in creating and piloting new compressed (accelerated) basic skills courses.
Provide professional development to faculty to support their work in creating and piloting directed learning activities for 50 gateway transfer courses.
Coach faculty members in the use of a menu of academic and non-academic support activities to differentiate assistance to students. The menu will include discrete basic skills lessons, directed learning activities, workshops on reading, writing, research, one-on-one group sessions, or any other activity relevant to a student’s courses or their transfer path.
Provide professional development to tutors to support their work with students.
Pilot a Transfer Academy on the Academy for College Excellence (ACE) model.
Hire a half-time bilingual counselor.
Provide loaner laptop computers.
The Teaching-Learning Center is the primary venue for services provided through the grant-support interventions for goal two.
Provide professional development to helpdesk staff to hone their expertise and interpersonal relations skills.
Provide professional development to faculty to support their work in creating and piloting new online or hybrid courses and to assist more experienced faculty members improve the quality of their course designs and pedagogy.
Goal three, improve civic engagement, is being supported by these interventions.
Establish a Civic Leadership Certificate.
Link community service directly to the curriculum through service learning internships and problem-based learning assignments.
Goal four, strengthening faculty teaching-learning skills, serves all three of the other goals through the development of innovative classroom approaches. The interventions are intended to facilitate and incentivize faculty participation through these annual steps.
Add six faculty members per year who are equipped to teach accelerated basic skills.
Introduce ten directed-learning activity pilot assignments per year.
Provide professional development in online/hybrid course design and pedagogy to six faculty members per year.
Cambridge West Partnership, LLC
221
Initiative | SSSP | Student Equity | Basic Skills | TRiO Student Support | CTE | Title V | AEBG | STEM | MESA | Noncredit SSSP |
Purpose | To increase California community college student access and success through the provision of core matriculation services with the goal of providing students with the support services necessary to assist them in achieving their education goal and identified course of student. Students need a plan. | To close achievement gaps in access and success in underrepresented student groups, as identified in local student equity plans. Research based focus on identifying gaps in student success especially for targeted student groups through the provision of specialized support/services. | Faculty and staff development to improve curriculum, instruction, student services, and program practices in the areas of basic skills and English as a Second Language (ESL) programs. | To empower first- generation, low-income, and students with disabilities as they prepare to obtain a two- year degree and/or transfer | To improve the quality and increase the quantity of career technical education provided by our system; courses, programs, pathways, credentials (licensure), certificates, degrees | An HSI grant (2015- 20) to improve completion rates through focusing on distance education, civic engagement, and strengthening learning programs such as acceleration and integration of academic support. | To align adult learning programs and bring adult schools under the CC districts. To increase adult student access and success. | To increase transfer and degree completion rates through increased support to STEM students, developing STEM guided pathways, and renewing STEM teaching and learning opportunities for faculty and students. | To support students ho are majors in math, engineering, or science and who are educationally disadvantaged and historically under- represented in college. | To increase Noncredit student access and success through the provision of core matriculation services with the goal of providing students with the support services necessary to assist them in achieving their education goal and identified course of student. Students need a |
Focus | Core Services:
Services
| Closing achievement gaps in 5 success indicators/goals:
| Funds shall be expended for:
programs. | Core Services
| Ongoing categorical funds to support CTE programs | Increasing student engagement and success through:
| Within the areas of courses for immigrants, High School Equivalency, Short-term Vocational, (Pre) Apprenticeships, and Programs for AWD
| Improve STEM student outcomes through increased student support. Strengthen STEM guided pathway success. Renew STEM teaching-learning opportunities. | Core Services
| Core Services for Noncredit students:
|
Initiative | SSSP | Student Equity | Basic Skills | TRiO Student Support | CTE | Title V | AEBG | STEM | MESA | Noncredit SSSP |
Goals/Metric | Increase CTE quantity: CTE enrollment, Improve quality: skills gains, completion, transfer, employment rates, employment in the field of study, earnings, median change in earnings, proportion of students who attained living wages | Increase in success and completion rates overall and closing equity gap in transfer rates for Hispanic students | Increases in enrollment, student transitions/ completion, increased certification and or income | Number of completed educational plans, orientations, assessments, and support services. | ||||||
Students to Be Served |
| Campus based research as to the extent of student equity by gender and for each of the following categories of students:
Alaska Native, Asian, Black or African American, Hispanic or Latino, Native Hawaiian or other Pacific Islander, White, some other race, more than one race. | To improve outcomes of students who enter college needing at least one course in ESL or basic skills, with particular emphasis on students transitioning into college (from high school, immigration, workforce, incarceration, etc.) |
and be (1) financially limited, (2) first- generation student, or (3) student with a verified disability | CTE students | TV is a Hispanic- serving institution grant designed to improve overall transfer rates by increasing success in online courses, accelerating students from basic skills through gateway transfer-level courses, and enhancing student engagement in college, community, and career exploration. | Students enrolled in the program areas listed above in local Adult Education programs and the Gavilan College non-credit program. | Hispanic/low income/first generation STEM students |
| All Noncredit students |
Cambridge West Partnership, LLC
222
Source: Gavilan College. Integrated Planning Task Force 2016-17
Gavilan College Program Matrix 2013
Service
Student
Program Service Description
Discipline(s) Student Target Primary Funding
Served/yr
EOPS | Case management, counseling, workshops, book voucher, and lending library. | All areas | Low income students | Categorical | Approx. 400 |
CalWORKs | Case management, counseling, job placement experience. | All areas | TANF students | Categorical | Approx. 300 |
Natural Science Supplemental Instructions | Student led sessions aid students outside of class time. | Natural Sciences | All students | STEM grant | Approx. 575 |
English Supplemental Instruction | In class tutoring, counseling, and workshops | English | All students | Title V | Approx. 550 |
First Year Experience | Students take reading and writing together and have access to tutoring and counseling services. | English | First time Basic skills students | Basic Skills grant | Approx. 350 |
Puente | Combines writing, counseling and mentoring to support students to transfer. | English | Hispanic, transfer student | Endowment/general fund | Approx. 50 |
Math boot camp | Summer program that prepares students for Math courses | Math | All students | STEM | Approx. 250 |
Disability resource center | Academic and physical accommodations, academic career, personal and vocational counseling, learning skills assessment, specialized tutoring, academic support classes, vocational preparation and job placement, and | All areas | Disability students and veterans | Categorical | Approx. 900 |
Student success center | Referrals, counseling, workshops. | All areas | ESL, Basic skills, new students | Title V | Approx. 500 |
TRIO | Academic counseling, cultural and social activities, and university visits. | All areas | First generations, low income, disabled | Categorical | 160 |
MESA | Study center | STEM | First generations, low income, STEM majors | MESA Grant | Approx. 250 |
Tutoring | Tutoring offered | All areas | All students | General fund | Approx. |
Writing Center | Support for students and their writing assignment, poetry, short stories, and business letters and resumes. Special events and workshops. | English | All students | General fund | Approx. |
Math lab | Provides Math tutoring | Math | All students | General fund | Approx. |
Service Learning | Community placement paired with classroom instruction incorporating experiences. | Social Science, English, Fine Arts | All students | Grant | Approx. 500 |
Acceleration | Combined reading and writing course that allow students to skip a Basic skills level | English | Basic skills students | Title V | Approx. 160 |
Early Alert | Provides notice and counseling to students who are at risk of failing. | All subjects | Students at risk of failing | Title V | Approx. 280 |
Counseling | Provides academic counseling | All subjects | All students | General fund | Approx. |
Learning Commons | 6,000-8,000 |
Source: Gavilan College Office of Institutional Research
Optimize enrollment, course offerings, and services to reflect community needs and growth.
Goal #1 Create an institutional approach to offer and integrate student outreach activities, recruitment, assessment, orientation, counseling, retention and follow-up efforts, with particular attention to educationally under-represented student populations.
Goal #2 Strengthen career programs by participating in regional career technical education collaboratives and initiatives from the Chancellor’s Office.
Goal #3 Increase course and program offerings, as funding allows with a particular emphasis on Transfer Model Curriculum (AA/AS-Ts).
Goal #4 Support programs that bridge pre-collegiate credit/non-credit courses and other learning support options intended to prepare students for entry into basic skills, transfer, and career technical programs.
Goal #5 Evaluate alternate delivery of courses and services such as online, hybrid, and High Step. Grow distance education program offerings as appropriate.
Goal #6 Use data to plan a complete general education transfer pattern of courses and appropriate basic skills and career technical courses at the Hollister and Morgan Hill facilities, and the Gilroy campus in the afternoons, evenings and weekends.
Goal #7 Work with the AB86 consortium to implement the established consortium plan.
Goal #1 Increase the student success, completion, and transfer rates using reasonable benchmarks specified by the College.
Goal #2 Use student learning outcomes assessment results to inform program plans and make program improvements.
Goal #3 Develop professional development activities for faculty to improve quality of teaching and curriculum for basic skills, career technical, and transfer courses.
Goal #4 Evaluate student support services to identify successful strategies and remediate gaps that may hinder student success in accordance with instructional improvement goals.
Goal #5 Provide a means to develop meaningful connections with educational and community partners.
Goal #6 Create communication methodology to increase the awareness of student well- being services such as mental health.
Improve and expand existing facilities to enhance the learning environment.
Goal #1 Expand facilities in the north and southeast portions of the district that will allow the expansion towards educational center size (20,000 square feet).
Goal #2 Use technology to improve existing classroom facility space, optimize academic success and administrative operations.
Goal #3 Integrate cost effective green practices for facilities, landscaping, and college systems into all campus improvements. Landscaping changes should include conversion of grass lawns to more sustainable and less water-consuming California native landscaping.
Goal #4 Establish permanent facility for South Bay Public Safety Consortium.
Goal #5 Create gathering spaces so students and staff may engage in scholarly interaction.
Goal #1 Create a staffing plan to better meet student needs after assessing staffing gaps in all departments.
Goal #2 Working with college department chairs and Academic Senate continue to implement a five-year full-time faculty hiring plan to ensure that 60% to 62% of credit courses are taught by full-time faculty.
Goal #3 Maintain competitive salary and benefit packages to ensure the attraction and retention of the best-qualified employees.
Goal #4 Determine the needs and scope of a Professional Development Plan for all employees
Goal #5 Promote a safe and healthy work environment through planned activities throughout the year.
Goal #6 Create institutional standards for customer service, for providing services to students and staff, with regular assessment.
Objective 1. Through the Student Services Council and other committees, review current practices and create technological and other processes to streamline services.
Objective 2. Create service learning outcomes that include customer service and student awareness of key processes and advisement.
Goal #7 Assess and remedy any identified gaps in the College’s Equal Opportunity Employment Plan and Equity Plan to comply with current legislation and reflect the community’s diversity.
Goal #8 Form institutional committees out of the Student Success Taskforce and the Student Equity Taskforce to permit accountability of decisions and allow for publication of minutes and meeting accessible to all.
Goal # 1 Develop a faculty, staff, and community driven plan for the expansion of educational programs and related educational specifications (i.e. specific facility needs).
Goal #2 Develop a proposed administrative structure and staffing plan to best support the expansion of facilities in San Benito County and Morgan Hill, through linkage to Strategy #4.
Goal #1 Improve communication processes among all stakeholders to increase awareness about planning activities, resource allocations, and significant factors affecting the college.
Goal #2 Create opportunities to improve integration and collaboration at every level, with emphasis on student success, e.g., a college hour, staff development opportunities.
Goal #3 Increase the number of opportunities for cross-disciplinary discussions with special attention to the inclusion of students, classified staff, and part-time faculty.
Goal #4 Strengthen and augment means for students to communicate among themselves and to the broader campus community on issues of common concern.
Goal #5 Broaden contacts and communication with local high schools, businesses, and agencies so such contact, collaboration, and feedback is widespread and frequent in all sectors of campus.
Develop and implement a plan for creating a College Life program, including outreach, recruitment, and support for increased numbers of international students. Goal #1 Research best models of College Life in community colleges, including student government, clubs, and community/service involvement and create a plan for Gavilan.
Goal #2 Propose a path to achieving the plan above, including resource development, staffing, and other infrastructure costs.
Goal #3 Research best models of international student outreach and recruitment. Develop a plan for Gavilan to expand current international student enrollment over a period of years to specified target numbers.
Goal #4 Based upon models used by colleges similar in size to Gavilan, propose a path to achieving a successful international student program, including partnerships, staffing, other infrastructure costs, and resources development.
Goal #5 Engage potential community and business partners in developing resources to support international students, including family hosting and internships.
Source: Gavilan College. Strategic Plan FY 2015-16 Through 2019-2020. August 11, 2015
Year In Which Gavilan College Student Transferred to California State University
CSU Concentration Name
2010-
2011
2011-
2012
2012-
2013
2013-
2014
2014-
2015
2015-
2016 Total Average
Undeclared | 42 | 33 | 19 | 9 | 20 | 5 | 128 | 12.8 |
Business Administration | 15 | 6 | 10 | 29 | 15 | 18 | 93 | 9.3 |
Psychology | 14 | 17 | 11 | 17 | 14 | 18 | 91 | 9.1 |
Criminal Justice | 10 | 15 | 6 | 19 | 16 | 14 | 80 | 8.0 |
Liberal Studies | 13 | 6 | 5 | 8 | 16 | 14 | 62 | 6.2 |
Kinesiology/Physical Education | 8 | 9 | 3 | 11 | 12 | 13 | 56 | 5.6 |
Sociology | 13 | 11 | 2 | 8 | 4 | 7 | 45 | 4.5 |
Speech Communication | 3 | 4 | 8 | 10 | 2 | 8 | 35 | 3.5 |
Human Services/Collaborative Human Services | 4 | 3 | 2 | 5 | 10 | 10 | 34 | 3.4 |
Social Science/Social and Behavioral Sciences | 3 | 8 | 4 | 10 | 3 | 6 | 34 | 3.4 |
Biology | 6 | 5 | 4 | 3 | 8 | 7 | 33 | 3.3 |
Child Development/Early Childhood Education | 3 | 2 | 8 | 5 | 7 | 4 | 29 | 2.9 |
Humanities | 7 | 4 | 2 | 2 | 8 | 4 | 27 | 2.7 |
Accountancy | 4 | 5 | 3 | 5 | 5 | 4 | 26 | 2.6 |
Art | 6 | 6 | 4 | 5 | 4 | 1 | 26 | 2.6 |
Communications | 3 | 4 | 3 | 4 | 4 | 7 | 25 | 2.5 |
English | 5 | 2 | 3 | 5 | 5 | 3 | 23 | 2.3 |
Health Science | 4 | 1 | 3 | 8 | 4 | 1 | 21 | 2.1 |
Marketing | 3 | 5 | 5 | 2 | 2 | 3 | 20 | 2.0 |
History | 4 | 3 | 3 | 3 | 2 | 4 | 19 | 1.9 |
Total for Top 20 Concentrations | 170 | 149 | 108 | 168 | 161 | 151 | 907 | 90.7 |
% of all CSU Transfers in Top 20 | 67% | 72% | 67% | 65% | 65% | 69% | 67% | |
Grand Total for all Concentrations | 255 | 207 | 161 | 259 | 246 | 220 | 1348 | 195.7 |
Source: California State University, Analytical Studies Unit. Community Colleges Transfers to the CSU. Retrieved February 1, 2017 from http://www.calstate.edu/as/index.shtml; analysis by Cambridge West Partnership, LLC
Cambridge West Partnership, LLC
Gavilan College Students Transfer to UC by Major
CIP 4* Instructional Program Name 2011-12 2012-13 2013-14 2014-15 2015-16 Total % of Total Average
42.01 | Psychology, General | 1 | 7 | 2 | 4 | 14 | 11.5% | 3.5 | |
26.01 | Biology, General | 4 | 1 | 4 | 2 | 1 | 12 | 9.8% | 2.4 |
45.11 | Sociology | 5 | 1 | 2 | 3 | 11 | 9.0% | 2.8 | |
45.06 | Economics | 2 | 1 | 3 | 2 | 8 | 6.6% | 2.0 | |
45.10 | Political Science and Government | 1 | 1 | 2 | 1 | 2 | 7 | 5.7% | 1.4 |
16.01 | Linguistic, Comparative, and Related Language Studies and Services | 1 | 2 | 2 | 5 | 4.1% | 1.7 | ||
01.09 | Animal Sciences | 1 | 2 | 1 | 4 | 3.3% | 1.3 | ||
26.02 | Biochemistry, Biophysics and Molecular Biology | 2 | 2 | 4 | 3.3% | 2.0 | |||
50.05 | Drama/Theatre Arts and Stagecraft | 1 | 2 | 1 | 4 | 3.3% | 1.3 | ||
26.04 | Cell/Cellular Biology and Anatomical Sciences | 2 | 1 | 3 | 2.5% | 1.5 | |||
52.06 | Business/Managerial Economics | 3 | 3 | 2.5% | 3.0 |
Total of all Instructional Programs 23 25 25 27 22 122 24.4
*U.S. Department of Education, Classification of Instructional Programs (4-digit code)
229
Source: University of California Information Center, Retrieved February 2, 2017 from https://www.universityofcalifornia.edu/infocenter/transfers-major; analysis by Cambridge West Partnership, LLC
Interpreting the Occupational Projection Data
The projections that are estimates based on information the EDD has received through surveys of employers assume that historical trends will continue into the future.
Therefore, unforeseen events occurring in the projection period may have an impact on employment levels. The projections should be supplemented, where possible, by documents such as those published by the Centers of Excellence, local and regional economic research materials, chambers of commerce reports, and information from local economic development agencies.
Emerging occupations may not be accurately reflected in the Standard Occupational Classification (SOC) titling, the current estimates of employment, or the future projections. Real-time LMI job posting data may be a good source of information about emerging trends and occupations.
The 2010 SOC system is used by federal and state agencies to classify workers into occupational categories for the purpose of collecting, calculating, or disseminating data. Workers are classified into one of 840 detailed occupations, which is a grouping of job titles that have a similar set of activities or tasks. The SOC classification system is managed by the Bureau of Labor Statistics (BLS) and will be updated next in 2018.
The typical entry-level education is also a coding system managed by the BLS. Local practice in a region may vary.
Wage data is aggregated at the county level, but does vary across counties for the same occupation. There can also be variation across counties on the entry-level education, on- the-job training, and work experience for the same occupation.
Determining a labor market gap using the demand data in conjunction with the supply data assembled by the Centers of Excellence should be done with caution.
Interpreting the Supply Data
The California community college data mart is the source of awards granted in that system. The California-specific Taxonomy of Programs (TOP) coding system is the means by which award data is organized. The counts in the data mart represent awards given, not the number of students who received the award. The federal Integrated Postsecondary Education Data system (IPEDS) reporting system is the source of awards from postsecondary institutions other than the California community colleges comes.
There is a one-year lag in the availability of that data. That federal reporting system uses the Classification of Instructional Programs (CIP) coding system. There may be errors in cross walking data from the CIP to TOP codes. The CIP code system is more detailed and nuanced compared to the TOP code system. There are inconsistencies in the classification of awards below the associate degree between the IPEDS and California community college system. IPEDS classifies by the duration of the program while the California public institutions classify by semester units.
It is very important to consider supply data on a regional basis rather than a single institution. That will include neighboring institutions whose graduates are also competing for job openings. Unfortunately, there is no agreement on the learning outcomes from educational programs. It is stressed to be aware that among the community colleges there can be differences in the TOP code each college selects for the same program of study.
Often, colleges look at graduation numbers to determine the supply of potential workers. However, this might underestimate or overestimate the number of qualified individuals. For example, community college students need to petition to receive an award once they meet the requirements, and some do not complete this final step. Students may not get a job in their field of study, or they may move out of the region to find work. In addition, skills-builder students who pass community college career and technical education courses frequently go on to secure significant wage gains, even if they do not complete a program. Completion numbers also do not account for differences in educational preferences or unique skills that program graduates possess (for example, being bilingual).
In addition to graduates of educational programs, there are other considerations on the supply side, such as existing underemployed/unemployed workers with the needed skills or work experience in the labor pool or graduates from outside the region able to take jobs are two other considerations.
The portion of projected annual average job opening employment opportunities for graduates of the community college in the South San Francisco Bay (Santa Clara, San Benito, Santa Cruz, and Monterey counties) area are similar to those in other urban/suburban areas of the state.
Average Annual Total Job Openings 2014-2024
Entry Level Education Monterey
Santa Cruz*
San Benito_
Less Than high School | 4,144 | 1,400 | 10,191 | 15,735 | 32.7% | |
High School Diploma or Equivalent | 1,881 | 1,098 | 8,543 | 11,522 | 23.9% |
Santa Clara Total % of Total % of Total
Subtotal 56.6%
Median Annual Wage 2016
![]()
$30,591
$46,474

Subtotal
8.4%
Some College, No Degree | 75 | 51 | 623 | 749 | 1.6% |
Postsecondary Certificate | 350 | 109 | 1,352 | 1,811 | 3.8% |
Associate's Degree | 93 | 131 | 1,250 | 1,474 | 3.1% |
$44,749
$52,488
$64,725
Bachelor's Degree | 886 | 506 | 13,920 | 15,312 | 31.8% |
Master's Degree | 78 | 54 | 507 | 639 | 1.3% |
Doctoral or Professional Degree | 109 | 40 | 784 | 933 | 1.9% |
Subtotal
35.0%
$85,430
$79,544
$111,632
Totals 7,616 3,389 37,170 48,175
*Santa Cruz projection data is 2012-2022
Source: California Employment Development Department, Labor Market Information; analysis by Cambridge West Partnership, LLC.
The importance of completing a Bachelor’s degree is illustrated by comparing the annual average job opening employment opportunities by urban dominated county in the state.
The greatest number of projected job openings for those with a Bachelor’s degree is in Santa Clara County.
EDD Average Annual Occupational Openings Projections 2014-2024 by Urban Areas
Entry Level Education San Diego Orange Los Angeles
Santa Clara
San Francisco
Sacra- mento
Less than high school | 34% | 36% | 39% | 27% | 30% | 35% |
High school diploma or equivalent | 30% | 30% | 28% | 23% | 21% | 28% |
Some college, no degree | 1% | 1% | 1% | 2% | 1% | 1% |
Postsecondary non-degree award | 5% | 4% | 5% | 4% | 3% | 5% |
Associate's degree | 3% | 2% | 2% | 3% | 2% | 2% |
Bachelor's degree | 24% | 23% | 20% | 37% | 29% | 22% |
Master's degree | 2% | 1% | 2% | 1% | 1% | 2% |
Doctoral or professional degree | 3% | 2% | 2% | 2% | 3% | 2% |
Source: California Employment Development Department, Labor Market Information; analysis by Cambridge West Partnership, LLC
In the following tables individual occupation that are projected to have 50 or more average annual job openings have been selected. The SOC code for the occupation has been matched to the TOP code for instructional programs offered by California community colleges. Each occupation may be associated with more than one TOP code. In those cases the subtotal row reflects the total number of graduates. The number of projected average annual openings is compared to the three-year average number of graduates from California community colleges in Santa Clara, San Benito, Santa Cruz, and Monterey Counties.
Santa Clara, San Benito, Santa Cruz, and Monterey Counties Occupational Projections 2014-2024 | |||||||
SOC | Occupational Title | Entry Level Education | Av An Total Jobs | TOP | Description | 3-Yr Av Graduates* | Gap |
151132 | Software Developers, Applications | Bachelor's | 070600 | Computer Science (Transfer) | 33 | ||
151132 | Software Developers, Applications | Bachelor's | 070710 | Computer Programming | 28 | ||
Subtotal | 2,032 | 61 | (1,971) | ||||
151133 | Software Developers, Systems Software | Bachelor's | 070710 | Computer Programming | 28 | ||
151133 | Software Developers, Systems Software | Bachelor's | 070700 | Computer Software Development | 0 | ||
151133 | Software Developers, Systems Software | Bachelor's | 070600 | Computer Science (Transfer) | 33 | ||
Subtotal | 868 | 61 | (807) | ||||
111021 | General and Operations Managers | Bachelor's | 050100 | Business and Commerce, General | 110 | ||
111021 | General and Operations Managers | Bachelor's | 050640 | Small Business and Entrepreneurship | 3 | ||
111021 | General and Operations Managers | Bachelor's | 050650 | Retail Store Operations and Management | 0 | ||
111021 | General and Operations Managers | Bachelor's | 050800 | International Business and Trade | 3 | ||
111021 | General and Operations Managers | Bachelor's | 050500 | Business Administration | 738 | ||
111021 | General and Operations Managers | Bachelor's | 050600 | Business Management | 17 | ||
Subtotal | 823 | 872 | 49 | ||||
291141 | Registered Nurses | Bachelor's | 727 | 123010 | Registered Nursing | 210 | (517) |
132011 | Accountants and Auditors | Bachelor's | 050210 | Tax Studies | 8 | ||
132011 | Accountants and Auditors | Bachelor's | 050200 | Accounting | 149 | ||
Subtotal | 651 | 157 | (494) | ||||
151121 | Computer Systems Analysts | Bachelor's | 070810 | Computer Networking | 32 | ||
151121 | Computer Systems Analysts | Bachelor's | 070200 | Computer Information Systems | 6 | ||
151121 | Computer Systems Analysts | Bachelor's | 070100 | Information Technology, General | 4 | ||
151121 | Computer Systems Analysts | Bachelor's | 070910 | E-Commerce (Technology emphasis) | 0 | ||
Subtotal | 650 | 42 | (608) | ||||
113021 | Computer and Information Systems Managers | Bachelor's | 510 | 070600 | Computer Science (Transfer) | 33 | (477) |
172061 | Computer Hardware Engineers | Bachelor's | 467 | ||||
131161 | Market Research Analysts and Marketing Specialists | Bachelor's | 380 | ||||
Cambridge West Partnership, LLC
233
Santa Clara, San Benito, Santa Cruz, and Monterey Counties Occupational Projections 2014-2024 | |||||||
SOC | Occupational Title | Entry Level Education | Av An Total Jobs | TOP | Description | 3-Yr Av Graduates* | Gap |
131111 | Management Analysts | Bachelor's | 050100 | Business and Commerce, General | 110 | ||
131111 | Management Analysts | Bachelor's | 050600 | Business Management | 17 | ||
131111 | Management Analysts | Bachelor's | 050500 | Business Administration | 738 | ||
Subtotal | 320 | 865 | 545 | ||||
252021 | Elementary School Teachers, Except Special Education | Bachelor's | 320 | ||||
119199 | Managers, All Other | Bachelor's | 050600 | Business Management | 17 | ||
119199 | Managers, All Other | Bachelor's | 050640 | Small Business and Entrepreneurship | 3 | ||
119199 | Managers, All Other | Bachelor's | 050500 | Business Administration | 738 | ||
119199 | Managers, All Other | Bachelor's | 050100 | Business and Commerce, General | 110 | ||
Subtotal | 308 | 868 | 560 | ||||
112021 | Marketing Managers | Bachelor's | 306 | ||||
131199 | Business Operations Specialists, All Other | Bachelor's | 294 | 050640 | Small Business and Entrepreneurship | 3 | (291) |
113031 | Financial Managers | Bachelor's | 268 | ||||
119041 | Architectural and Engineering Managers | Bachelor's | 249 | ||||
112022 | Sales Managers | Bachelor's | 050100 | Business and Commerce, General | 110 | ||
112022 | Sales Managers | Bachelor's | 050640 | Small Business and Entrepreneurship | 3 | ||
112022 | Sales Managers | Bachelor's | 050600 | Business Management | 17 | ||
112022 | Sales Managers | Bachelor's | 050500 | Business Administration | 738 | ||
Subtotal | 234 | 868 | 634 | ||||
414011 | Sales Representatives, Wholesale and Manufacturing, Technical and Scientific Products | Bachelor's | 213 | 050800 | International Business and Trade | 3 | (210) |
151142 | Network and Computer Systems Administrators | Bachelor's | 196 | 070800 | Computer Infrastructure and Support | 0 | (196) |
152031 | Operations Research Analysts | Bachelor's | 189 | ||||
131071 | Human Resources Specialists | Bachelor's | 175 | ||||
Cambridge West Partnership, LLC
234
Santa Clara, San Benito, Santa Cruz, and Monterey Counties Occupational Projections 2014-2024 | |||||||
SOC | Occupational Title | Entry Level Education | Av An Total Jobs | TOP | Description | 3-Yr Av Graduates* | Gap |
252031 | Secondary School Teachers, Except Special and Career/Technical Education | Bachelor's | 172 | ||||
172072 | Electronics Engineers, Except Computer | Bachelor's | 167 | 093400 | Electronics and Electric Technology | 1 | (166) |
151131 | Computer Programmers | Bachelor's | 070710 | Computer Programming | 28 | ||
151131 | Computer Programmers | Bachelor's | 070600 | Computer Science (Transfer) | 33 | ||
151131 | Computer Programmers | Bachelor's | 070700 | Computer Software Development | 0 | ||
Subtotal | 159 | 61 | (98) | ||||
172112 | Industrial Engineers | Bachelor's | 158 | ||||
272022 | Coaches and Scouts | Bachelor's | 157 | ||||
172141 | Mechanical Engineers | Bachelor's | 156 | ||||
131023 | Purchasing Agents, Except Wholesale, Retail, and Farm Products | Bachelor's | 153 | 050900 | Marketing and Distribution | 9 | (144) |
132051 | Financial Analysts | Bachelor's | 144 | ||||
253098 | Substitute Teachers | Bachelor's | 144 | ||||
172071 | Electrical Engineers | Bachelor's | 138 | ||||
252022 | Middle School Teachers, Except Special and Career/Technical Education | Bachelor's | 129 | ||||
151199 | Computer Occupations, All Other | Bachelor's | 079900 | Other Information Technology | 0 | ||
151199 | Computer Occupations, All Other | Bachelor's | 070200 | Computer Information Systems | 6 | ||
151199 | Computer Occupations, All Other | Bachelor's | 070100 | Information Technology, General | 4 | ||
151199 | Computer Occupations, All Other | Bachelor's | 070600 | Computer Science (Transfer) | 33 | ||
Subtotal | 128 | 43 | (85) | ||||
Cambridge West Partnership, LLC
235
Santa Clara, San Benito, Santa Cruz, and Monterey Counties Occupational Projections 2014-2024 | |||||||
SOC | Occupational Title | Entry Level Education | Av An Total Jobs | TOP | Description | 3-Yr Av Graduates* | Gap |
113011 | Administrative Services Managers | Bachelor's | 050500 | Business Administration | 738 | ||
113011 | Administrative Services Managers | Bachelor's | 050100 | Business and Commerce, General | 110 | ||
113011 | Administrative Services Managers | Bachelor's | 050600 | Business Management | 17 | ||
113011 | Administrative Services Managers | Bachelor's | 050640 | Small Business and Entrepreneurship | 3 | ||
113011 | Administrative Services Managers | Bachelor's | 050630 | Management Development and Supervision | 0 | ||
Subtotal | 113 | 869 | 756 | ||||
172051 | Civil Engineers | Bachelor's | 112 | ||||
419031 | Sales Engineers | Bachelor's | 111 | ||||
131151 | Training and Development Specialists | Bachelor's | 109 | ||||
253097 | Teachers and Instructors, All Other, Except Substitute Teachers | Bachelor's | 105 | ||||
119111 | Medical and Health Services Managers | Bachelor's | 104 | ||||
151143 | Computer Network Architects | Bachelor's | 070810 | Computer Networking | 32 | ||
151143 | Computer Network Architects | Bachelor's | 070800 | Computer Infrastructure and Support | 0 | ||
Subtotal | 103 | 32 | (71) | ||||
271024 | Graphic Designers | Bachelor's | 061400 | Digital Media | 12 | ||
271024 | Graphic Designers | Bachelor's | 103000 | Graphic Art and Design | 36 | ||
Subtotal | 94 | 48 | (46) | ||||
172199 | Engineers, All Other | Bachelor's | 94 | ||||
271024 | Graphic Designers | Bachelor's | 94 | 061460 | Computer Graphics and Digital Imagery | 4 | (90) |
119021 | Construction Managers | Bachelor's | 93 | 095700 | Civil and Construction Management Technology | 9 | (84) |
Cambridge West Partnership, LLC
236
Santa Clara, San Benito, Santa Cruz, and Monterey Counties Occupational Projections 2014-2024 | |||||||
SOC | Occupational Title | Entry Level Education | Av An Total Jobs | TOP | Description | 3-Yr Av Graduates* | Gap |
131051 | Cost Estimators | Bachelor's | 095200 | Construction Crafts Technology | 11 | ||
131051 | Cost Estimators | Bachelor's | 050100 | Business and Commerce, General | 110 | ||
131051 | Cost Estimators | Bachelor's | 050500 | Business Administration | 738 | ||
131051 | Cost Estimators | Bachelor's | 050600 | Business Management | 17 | ||
Subtotal | 88 | 876 | 788 | ||||
113121 | Human Resources Managers | Bachelor's | 76 | ||||
113051 | Industrial Production Managers | Bachelor's | 050600 | Business Management | 17 | ||
113051 | Industrial Production Managers | Bachelor's | 050100 | Business and Commerce, General | 110 | ||
113051 | Industrial Production Managers | Bachelor's | 050500 | Business Administration | 738 | ||
Subtotal | 74 | 865 | 791 | ||||
132052 | Personal Financial Advisors | Bachelor's | 70 | ||||
111011 | Chief Executives | Bachelor's | 64 | ||||
273091 | Interpreters and Translators | Bachelor's | 63 | ||||
151141 | Database Administrators | Bachelor's | 070720 | Database Design and Administration | 0 | ||
151141 | Database Administrators | Bachelor's | 070800 | Computer Infrastructure and Support | 0 | ||
151141 | Database Administrators | Bachelor's | 070100 | Information Technology, General | 4 | ||
Subtotal | 63 | 4 | (59) | ||||
273042 | Technical Writers | Bachelor's | 56 | 060700 | Technical Communication | 0 | (56) |
271014 | Multimedia Artists and Animators | Bachelor's | 103000 | Graphic Art and Design | 36 | ||
271014 | Multimedia Artists and Animators | Bachelor's | 061460 | Computer Graphics and Digital Imagery | 4 | ||
271014 | Multimedia Artists and Animators | Bachelor's | 061440 | Animation | 8 | ||
271014 | Multimedia Artists and Animators | Bachelor's | 061400 | Digital Media | 12 | ||
Subtotal | 56 | 60 | 4 | ||||
Cambridge West Partnership, LLC
237
Santa Clara, San Benito, Santa Cruz, and Monterey Counties Occupational Projections 2014-2024 | |||||||
SOC | Occupational Title | Entry Level Education | Av An Total Jobs | TOP | Description | 3-Yr Av Graduates* | Gap |
131022 | Wholesale and Retail Buyers, Except Farm Products | Bachelor's | 050900 | Marketing and Distribution | 9 | ||
131022 | Wholesale and Retail Buyers, Except Farm Products | Bachelor's | 050800 | International Business and Trade | 3 | ||
Subtotal | 56 | 12 | (44) | ||||
271014 | Multimedia Artists and Animators | Bachelor's | 56 | 061410 | Multimedia | 10 | (46) |
413031 | Securities, Commodities, and Financial Services Sales Agents | Bachelor's | 54 | ||||
252012 | Kindergarten Teachers, Except Special Education | Bachelor's | 52 | ||||
131081 | Logisticians | Bachelor's | 50 | ||||
Cambridge West Partnership, LLC
238
Santa Clara, San Benito, Santa Cruz, and Monterey Counties Occupational Projections 2014-2024 | |||||||
SOC | Occupational Title | Entry Level Education | Av An Total Jobs | TOP | Description | 3-Yr Av Graduates* | Gap |
252011 | Preschool Teachers, Except Special Education | Associate | 228 | 130500 | Child Development/Early Care and Education | 165 | (63) |
173023 | Electrical and Electronics Engineering Technicians | Associate | 093400 | Electronics and Electric Technology | 1 | ||
173023 | Electrical and Electronics Engineering Technicians | Associate | 092400 | Engineering Technology, General (requires Trigonometry) | 1 | ||
173023 | Electrical and Electronics Engineering Technicians | Associate | 093410 | Computer Electronics | 1 | ||
173023 | Electrical and Electronics Engineering Technicians | Associate | 095220 | Electrical | 0 | ||
Subtotal | 192 | 3 | (189) | ||||
151134 | Web Developers | Associate | 070900 | World Wide Web Administration | 0 | ||
151134 | Web Developers | Associate | 070710 | Computer Programming | 28 | ||
151134 | Web Developers | Associate | 070700 | Computer Software Development | 0 | ||
151134 | Web Developers | Associate | 070600 | Computer Science (Transfer) | 33 | ||
151134 | Web Developers | Associate | 061430 | Website Design and Development | 6 | ||
151134 | Web Developers | Associate | 070910 | E-Commerce (Technology emphasis) | 0 | ||
Subtotal | 159 | 68 | (91) | ||||
194099 | Life, Physical, and Social Science Technicians, All Other | Associate | 100 | 043000 | Biotechnology and Biomedical Technology | 0 | (100) |
232011 | Paralegals and Legal Assistants | Associate | 97 | 140200 | Paralegal | 81 | (16) |
151152 | Computer Network Support Specialists | Associate | 070810 | Computer Networking | 32 | ||
151152 | Computer Network Support Specialists | Associate | 070800 | Computer Infrastructure and Support | 0 | ||
151152 | Computer Network Support Specialists | Associate | 070600 | Computer Science (Transfer) | 33 | ||
151152 | Computer Network Support Specialists | Associate | 070820 | Computer Support | 8 | ||
Subtotal | 96 | 74 | (22) | ||||
Cambridge West Partnership, LLC
239
Santa Clara, San Benito, Santa Cruz, and Monterey Counties Occupational Projections 2014-2024 | |||||||
SOC | Occupational Title | Entry Level Education | Av An Total Jobs | TOP | Description | 3-Yr Av Graduates* | Gap |
291141 | Registered Nurses | Associate | 63 | 123010 | Registered Nursing | 56 | (7) |
292021 | Dental Hygienists | Associate | 53 | 124020 | Dental Hygienist | 41 | (12) |
519141 | Semiconductor Processors | Associate | 52 | ||||
Santa Cruz County projections are for 2012-22 | |||||||
*latest available 3-Yr Average community colleges 2013-14 to 2015-16 | |||||||
**Data sources: U.S. Bureau of Labor Statistics' Current Employment Statistics (CES) March 2015 benchmark, Quarterly Census of Employment and Wages (QCEW) industry employment, and Occupational Employment Statistics (OES) data. Centers of Excellence Supply Tables; analysis by Cambridge West Partnership, LLC | |||||||
Cambridge West Partnership, LLC
240
Santa Clara, San Benito, Santa Cruz, and Monterey Counties Occupational Projections 2014-2024 | |||||||
SOC | Occupational Title | Entry Level Education | Av An Total Jobs | TOP | Description | 3-Yr Av Graduates* | Gap |
319092 | Medical Assistants | Certificate | 120810 | Clinical Medical Assisting | 28 | ||
319092 | Medical Assistants | Certificate | 120800 | Medical Assisting | 90 | ||
Subtotal | 255 | 118 | (137) | ||||
311014 | Nursing Assistants | Certificate | 228 | 123030 | Certified Nurse Assistant | (228) | |
533032 | Heavy and Tractor-Trailer Truck Drivers | Certificate | 209 | ||||
395012 | Hairdressers, Hairstylists, and Cosmetologists | Certificate | 171 | 300700 | Cosmetology and Barbering | 145 | (26) |
319091 | Dental Assistants | Certificate | 163 | 124010 | Dental Assistant | 65 | (98) |
292061 | Licensed Practical and Licensed Vocational Nurses | Certificate | 144 | 123020 | Licensed Vocational Nursing | 70 | (74) |
493023 | Automotive Service Technicians and Mechanics | Certificate | 144 | 094800 | Automotive Technology | 147 | 3 |
332011 | Firefighters | Certificate | 68 | 213300 | Fire Technology | 3 | (65) |
254031 | Library Technicians | Certificate | 56 | ||||
259041 | Teacher Assistants | Some College | 303 | 080900 | Special Education | 4 | (299) |
151151 | Computer User Support Specialists | Some College | 274 | 070820 | Computer Support | 12 | (262) |
433031 | Bookkeeping, Accounting, and Auditing Clerks | Some College | 122 | 050200 | Accounting | 118 | (4) |
Santa Cruz County projections are for 2012-22 | |||||||
*latest available 3-Yr Average community colleges 2013-14 to 2015-16 | |||||||
**Data sources: U.S. Bureau of Labor Statistics' Current Employment Statistics (CES) March 2015 benchmark, Quarterly Census of Employment and Wages (QCEW) industry employment, and Occupational Employment Statistics (OES) data. Centers of Excellence Supply Tables; analysis by Cambridge West Partnership, LLC | |||||||
Cambridge West Partnership, LLC
241
EDD Occupational Projections 2014-2024, Annual Salary, Work Experience and OJT Expected/Required | |||||||||||||||
2016 Q1 Median Annual Salary | Work Experience Expected | On-The-Job Training | |||||||||||||
SOC | Occupational Title | Entry Level Education | Average Annual Total Jobs | Monterey | Santa Cruz | Santa Clara San Benito | Average | Monterey | Santa Cruz | Santa Clara San Benito | Monterey | Santa Cruz | Santa Clara San Benito | ||
151132 | Software Developers, Applications | Bachelor's | 2,032 | $108,145 | $100,696 | $143,277 | $117,373 | None | None | None | None | None | None | ||
151133 | Software Developers, Systems Software | Bachelor's | 868 | $94,013 | $86,441 | $142,029 | $107,494 | None | None | None | None | None | None | ||
111021 | General and Operations Managers | Bachelor's | 823 | $96,727 | $90,669 | $142,727 | $110,041 | ≥5 years | <5 years | ≥5 years | None | None | None | ||
291141 | Registered Nurses | Bachelor's | 727 | $106,359 | $132,361 | $119,360 | None | None | None | None | |||||
132011 | Accountants and Auditors | Bachelor's | 651 | $79,422 | $71,505 | $91,559 | $80,829 | None | None | None | None | None | None | ||
151121 | Computer Systems Analysts | Bachelor's | 650 | $93,232 | $82,880 | $114,323 | $96,812 | None | None | None | None | None | None | ||
113021 | Computer and Information Systems Managers | Bachelor's | 510 | $144,661 | $134,779 | $182,760 $154,067 | ≥5 years | ≥5 years | ≥5 years | None | None | None | |||
172061 | Computer Hardware Engineers | Bachelor's | 467 | $142,080 | $142,080 | None | None | ||||||||
131161 | Market Research Analysts and Marketing Specialists | Bachelor's | 380 | $65,341 | $48,171 | $115,372 | $76,295 | None | None | None | None | None | None | ||
131111 | Management Analysts | Bachelor's | 320 | $73,743 | $94,074 | $112,937 | $93,585 | <5 years | <5 years | <5 years | None | None | None | ||
252021 | Elementary School Teachers, Except Special Education | Bachelor's | 320 | $71,857 | $67,390 | $76,077 | $71,775 | None | None | None | I/R | I/R | I/R | ||
119199 | Managers, All Other | Bachelor's | 308 | $113,612 | $152,182 | $132,897 | <5 years | <5 years | None | None | |||||
112021 | Marketing Managers | Bachelor's | 306 | $106,387 | $122,024 | $114,206 | ≥5 years | ≥5 years | ≥5 years | None | None | None | |||
131199 | Business Operations Specialists, All Other | Bachelor's | 294 | $74,285 | $94,844 | $84,565 | None |
| None | None | |||||
113031 | Financial Managers | Bachelor's | 268 | $104,218 | $106,749 | $166,274 $125,747 | ≥5 years | ≥5 years | ≥5 years | None | None | None | |||
119041 | Architectural and Engineering Managers | Bachelor's | 249 | $125,954 | $151,746 | $182,924 | $153,541 | ≥5 years | ≥5 years | ≥5 years | None | None | None | ||
112022 | Sales Managers | Bachelor's | 234 | $95,305 | $113,329 | $155,877 | $121,504 | <5 years | <5 years | <5 years | None | None | None | ||
414011 | Sales Representatives, Wholesale and Manufacturing, Technical and Scientific Products | Bachelor's | 213 | $70,710 | $80,104 | $106,949 | $85,921 | None | None | None | MT OJT | MT OJT | MT OJT | ||
151142 | Network and Computer Systems Administrators | Bachelor's | 196 | $64,042 | $102,890 | $83,466 | None | None | None | None | |||||
152031 | Operations Research Analysts | Bachelor's | 189 | $115,571 | $115,571 | None | None | ||||||||
131071 | Human Resources Specialists | Bachelor's | 175 | $67,746 | $60,856 | $83,219 | $70,607 | None | None | None |
| None | None | None | |
252031 | Secondary School Teachers, Except Special and Career/Technical Education | Bachelor's | 172 | $68,787 | $76,635 | $72,711 | None | None | I/R | I/R | |||||
172072 | Electronics Engineers, Except Computer | Bachelor's | 167 | $92,076 | $127,765 | $109,921 | None | None | None | None | |||||
151131 | Computer Programmers | Bachelor's | 159 | $84,822 | $105,674 | $94,429 | $94,975 | None | None | None | None | None | None | ||
172112 | Industrial Engineers | Bachelor's | 158 | $92,835 | $116,565 | $104,700 | None | None | None | None | |||||
272022 | Coaches and Scouts | Bachelor's | 157 | $52,267 | $39,447 | $30,770 | $40,828 | None | None | None | None | None | None | ||
172141 | Mechanical Engineers | Bachelor's | 156 | $90,949 | $93,665 | $116,799 | $100,471 | None | None | None | None | None | None | ||
131023 | Purchasing Agents, Except Wholesale, Retail, and Farm Products | Bachelor's | 153 | $67,295 | $78,726 | None | None | LT OJT | LT OJT | ||||||
$73,011 | |||||||||||||||
132051 | Financial Analysts | Bachelor's | 144 | $80,466 | $86,729 | $109,918 | $92,371 | None | None | None | None | None | None | ||
253098 | Substitute Teachers | Bachelor's | 144 | $39,565 | $28,075 | $43,177 | $36,939 | None | N/A | None | I/R | N/A | I/R | ||
172071 | Electrical Engineers | Bachelor's | 138 | $117,184 | $98,035 | $139,899 | $118,373 | None | None | None | None | None | None | ||
252022 | Middle School Teachers, Except Special and Career/Technical Education | Bachelor's | 129 | $69,097 | $53,328 | $77,223 | $66,549 | None | None | None | I/R | I/R | I/R | ||
151199 | Computer Occupations, All Other | Bachelor's | 128 | $101,175 | $87,736 | $122,013 | $103,641 | None | None | None | None | None | None | ||
113011 | Administrative Services Managers | Bachelor's | 113 | $72,218 | $87,868 | $119,732 | $93,273 | <5 years | <5 years | <5 years | None | None | None | ||
172051 | Civil Engineers | Bachelor's | 112 | $96,864 | $89,628 | $103,712 | $96,735 | None | None | None | None | None | None | ||
![]()
![]()
![]()
![]()
![]()
![]()
![]()
![]()
![]()
![]()
![]()
![]()
![]()
![]()
![]()
![]()
![]()
Cambridge West Partnership, LLC
242
EDD Occupational Projections 2014-2024, Annual Salary, Work Experience and OJT Expected/Required | |||||||||||||||
2016 Q1 Median Annual Salary | Work Experience Expected | On-The-Job Training | |||||||||||||
SOC | Occupational Title | Entry Level Education | Average Annual Total Jobs | Monterey | Santa Cruz | Santa Clara San Benito | Average | Monterey | Santa Cruz | Santa Clara San Benito | Monterey | Santa Cruz | Santa Clara San Benito | ||
419031 | Sales Engineers | Bachelor's | 111 | $75,186 | $125,700 | $100,443 | None | None | MT OJT | MT OJT | |||||
131151 | Training and Development Specialists | Bachelor's | 109 | $65,269 | $65,299 | $95,724 | $75,431 | <5 years | <5 years | <5 years | None | None | None | ||
253097 | Teachers and Instructors, All Other, Except Substitute Teachers | Bachelor's | 105 | $67,170 | $40,965 | $54,068 | None | None | I/R | I/R | |||||
119111 | Medical and Health Services Managers | Bachelor's | 104 | $96,451 | $116,784 | $158,138 | $123,791 | <5 years | None | <5 years | None | None | None | ||
151143 | Computer Network Architects | Bachelor's | 103 | $94,656 | $146,006 | $120,331 | ≥5 years | ≥5 years | None | None | |||||
172199 | Engineers, All Other | Bachelor's | 94 | $99,370 | $123,839 $111,605 | None | None | None | None | ||||||
271024 | Graphic Designers | Bachelor's | 94 | $43,725 | $49,695 | $72,384 | $55,268 | None | None | None | None | None | None | ||
119021 | Construction Managers | Bachelor's | 93 | $85,204 | $104,623 | $124,286 | $104,704 | None | None | None | MT OJT | MT OJT | MT OJT | ||
131051 | Cost Estimators | Bachelor's | 88 | $74,398 | $51,878 | $82,216 | $69,497 | None | None | None | None | None | None | ||
113121 | Human Resources Managers | Bachelor's | 76 | $94,772 | $101,178 | $161,566 | $119,172 | ≥5 years | ≥5 years | ≥5 years | None | None | None | ||
113051 | Industrial Production Managers | Bachelor's | 74 | $78,010 | $89,863 | $140,936 | $102,936 | ≥5 years | ≥5 years | ≥5 years | None | None | None | ||
132052 | Personal Financial Advisors | Bachelor's | 70 | $112,681 | $58,861 | $96,369 | $89,304 | None | None | None | LT OJT | None | LT OJT | ||
111011 | Chief Executives | Bachelor's | 64 | $164,955 | $164,955 | ≥5 years | ≥5 years | ≥5 years | None | None | None | ||||
151141 | Database Administrators | Bachelor's | 63 | $82,681 | $86,866 | $103,488 $91,012 | <5 years | <5 years | <5 years | None | None | None | |||
273091 | Interpreters and Translators | Bachelor's | 63 | $20,087 | $68,022 | $44,055 | None | None | ST OJT | ST OJT | |||||
291141 | Registered Nurses | Bachelor's | 63 | $106,359 | $132,361 | $119,360 | None | None | None | None | |||||
131022 | Wholesale and Retail Buyers, Except Farm Products | Bachelor's | 56 | $47,187 | $59,702 | $53,445 | None | None | LT OJT | LT OJT | |||||
271014 | Multimedia Artists and Animators | Bachelor's | 56 | $73,733 | $73,733 | None | MT OJT | ||||||||
273042 | Technical Writers | Bachelor's | 56 | $106,038 $114,293 | $110,166 | <5 years | <5 years | ST OJT | ST OJT | ||||||
413031 | Securities, Commodities, and Financial Services Sales Agents | Bachelor's | 54 | $66,494 | $48,316 | $54,495 | $56,435 | None | None | None | MT OJT | MT OJT | MT OJT | ||
252012 | Kindergarten Teachers, Except Special Education | Bachelor's | 52 | $60,809 | $60,389 | $67,038 $62,745 | None | None | None | I/R | I/R | I/R | |||
131081 | Logisticians | Bachelor's | 50 | $76,250 | $69,974 | $107,257 | $84,494 | None | None | None | None | None | None | ||
291141 | Registered Nurses | Associate | 727 | $94,909 | $94,909 | None | None | ||||||||
252011 | Preschool Teachers, Except Special Education | Associate | 228 | $35,304 | $28,571 | $37,668 | $33,848 | None | None | None | None | None | None | ||
173023 | Electrical and Electronics Engineering Technicians | Associate | 192 | $62,584 | $58,973 | $64,999 | $62,185 | None | None | None | None | None | None | ||
151134 | Web Developers | Associate | 159 | $81,007 | $56,869 | $105,193 | $81,023 | None | None | None | None | None | None | ||
194099 | Life, Physical, and Social Science Technicians, All Other | Associate | 100 | $49,375 | $54,757 | None | None | None | None | ||||||
$60,139 | |||||||||||||||
232011 | Paralegals and Legal Assistants | Associate | 97 | $54,377 | $66,196 $60,287 | None | None | None | None | ||||||
151152 | Computer Network Support Specialists | Associate | 96 | $62,229 | $66,460 | $89,712 | $72,800 | None | None | None | None | None | None | ||
291141 | Registered Nurses | Associate | 63 | $94,909 | $94,909 | None | None | ||||||||
292021 | Dental Hygienists | Associate | 53 | $106,453 | $99,248 | $102,851 | None | None | None | None | |||||
519141 | Semiconductor Processors | Associate | 52 | $38,645 | $38,645 | None | MT OJT | ||||||||
![]()
![]()
![]()
![]()
![]()
![]()
![]()
![]()
Cambridge West Partnership, LLC
243
EDD Occupational Projections 2014-2024, Annual Salary, Work Experience and OJT Expected/Required | |||||||||||||||
2016 Q1 Median Annual Salary | Work Experience Expected | On-The-Job Training | |||||||||||||
SOC | Occupational Title | Entry Level Education | Average Annual Total Jobs | Monterey | Santa Cruz | Santa Clara San Benito | Average | Monterey | Santa Cruz | Santa Clara San Benito | Monterey | Santa Cruz | Santa Clara San Benito | ||
319092 | Medical Assistants | Certificate | 255 | $31,163 | $40,558 | $43,308 | $38,343 | None | None | None | None | None | None | ||
311014 | Nursing Assistants | Certificate | 228 | $31,897 | $30,837 | $31,367 | None | None | None | None | |||||
533032 | Heavy and Tractor-Trailer Truck Drivers | Certificate | 209 | $44,977 | $43,495 | $42,145 | $43,539 | None | None | None | ST OJT | ST OJT | ST OJT | ||
395012 | Hairdressers, Hairstylists, and Cosmetologists | Certificate | 171 | $22,281 | $22,128 | $23,352 | $22,587 | None | None | None | None | None | None | ||
319091 | Dental Assistants | Certificate | 163 | $41,055 | $39,349 | $51,741 | $44,048 | None | None | None | None | None | None | ||
292061 | Licensed Practical and Licensed Vocational Nurses | Certificate | 144 | $51,130 | $54,623 | $58,932 | $54,895 | None | None | None | None | None | None | ||
493023 | Automotive Service Technicians and Mechanics | Certificate | 144 | $44,368 | $52,084 | $48,226 | None | None | ST OJT | ST OJT | |||||
332011 | Firefighters | Certificate | 68 | $57,319 | $58,353 | $74,889 | $63,520 | None | None | None | LT OJT | LT OJT | LT OJT | ||
254031 | Library Technicians | Certificate | 56 | $34,757 | $40,924 | $50,086 | $41,922 | None | None | None | None | None | None | ||
259041 | Teacher Assistants | Some College | 303 | $33,671 | $28,935 | $31,145 | $31,250 | None | None | None | None | None | None | ||
151151 | Computer User Support Specialists | Some College | 274 | $47,813 | $53,601 | $77,132 | $59,515 | None | None | None | None | MT OJT | None | ||
433031 | Bookkeeping, Accounting, and Auditing Clerks | Some College | 122 | $43,206 | $49,141 | $46,174 | None | None | MT OJT | MT OJT | |||||
**Data sources: U.S. Bureau of Labor Statistics' Current Employment Statistics (CES) March 2015 benchmark, Quarterly Census of Employment and Wages (QCEW) industry employment, and Occupational Employment Statistics (OES) data; analysis by Cambridge West Partnership, LLC | |||||||||||||||
On-The-Job Training Codes: | |||||||||||||||
I/R- Internship/Residency | |||||||||||||||
LT OJT- Long Tern More than 12 months and formal classroom instruction | |||||||||||||||
MT OJT- Medium Term >1 mo. < 12 mos. | |||||||||||||||
ST OJT 1 month or less | |||||||||||||||
Cambridge West Partnership, LLC
244
Source: California Employment Development Department, Labor Market Information. California Community Colleges Center of Excellence Supply Database; analysis by Cambridge West Partnership, LLC
Cambridge West Partnership, LLC
Occupations with the Greatest Gap Between Projected Annual Average Openings and Three-Year Average Graduates
SOC Code | Occupation Title | Entry Level Education | Gavilan Program? | TOP | Annual Average Total Jobs | 3-year Average Graduates | Gap |
151132 | Software Developers, Applications | Bachelor's | Y | 070600, 070710 | 2,032 | 61 | -1,971 |
151133 | Software Developers, Systems Software | Bachelor's | Y | 070600, 070710 | 868 | 61 | -807 |
151121 | Computer Systems Analysts | Bachelor's | Y | 070810, 070200 | 650 | 42 | -608 |
291141 | Registered Nurses | Bachelor's | Y | 123010 | 727 | 210 | -517 |
132011 | Accountants and Auditors | Bachelor's | Y | 50200 | 651 | 157 | -494 |
113021 | Computer and Information Systems Managers | Bachelor's | Y | 070600 | 510 | 33 | -477 |
172061 | Computer Hardware Engineers | Bachelor's | N | 467 | 0 | -467 | |
131161 | Market Research Analysts and Marketing Specialists | Bachelor's | N | 380 | 0 | -380 | |
252021 | Elementary School Teachers, Except Special Education | Bachelor's | N | 320 | 0 | -320 | |
112021 | Marketing Managers | Bachelor's | N | 306 | 0 | -306 | |
259041 | Teacher Assistants | Some College | N | 080900 | 303 | 4 | -299 |
131199 | Business Operations Specialists, All Other | Bachelor's | N | 050640 | 294 | 3 | -291 |
113031 | Financial Managers | Bachelor's | N | 268 | 0 | -268 | |
151151 | Computer User Support Specialists | Some College | N | 070820 | 274 | 12 | -262 |
119041 | Architectural and Engineering Managers | Bachelor's | N | 249 | 0 | -249 | |
311014 | Nursing Assistants | Certificate | N | 228 | 0 | -228 | |
414011 | Sales Representatives, Wholesale and Manufacturing, Technical and Scientific Products | Bachelor's | N | 050800 | 213 | 3 | -210 |
533032 | Heavy and Tractor-Trailer Truck Drivers | Certificate | N | 209 | 0 | -209 | |
151142 | Network and Computer Systems Administrators | Bachelor's | Y | 196 | 0 | -196 | |
152031 | Operations Research Analysts | Bachelor's | N | 189 | 0 | -189 | |
173023 | Electrical and Electronics Engineering Technicians | Associate | N | 093400, 092400, 093410, 095220 | 192 | 3 | -189 |
Total -8,936
245
Source: Employment Development Department. Labor market Information, Occupational Projections 2014-2024; analysis by Cambridge West Partnership, LLC
Cambridge West Partnership, LLC
Actual
246
Projected | ||||||||||||||||
2020 | 2025 | 2030 | ||||||||||||||
# of | Lec | Lab | Total | # of | Lec | Lab | Total | # of | Lec | Lab | Total | |||||
Sec | WSCH | WSCH | WSCH | FTES | Sec | WSCH | WSCH | WSCH | FTES | Sec | WSCH | WSCH | WSCH | FTES | ||
79 | 5,073.6 | 691.9 | 5,765.4 | 186.7 | 91 | 5,865.9 | 799.9 | 6,665.8 | 215.8 | 106 | 6,785.2 | 925.3 | 7,710.4 | 249.7 | ||
8 | 886.2 | 0.0 | 886.2 | 28.7 | 10 | 1,024.6 | 0.0 | 1,024.6 | 33.2 | 11 | 1,185.3 | 0.0 | 1,185.3 | 38.4 | ||
6 | 681.8 | 0.0 | 681.8 | 22.1 | 7 | 788.3 | 0.0 | 788.3 | 25.5 | 8 | 911.8 | 0.0 | 911.8 | 29.5 | ||
23 | 1,018.4 | 1,810.4 | 2,828.8 | 91.6 | 26 | 1,177.4 | 2,093.1 | 3,270.5 | 105.9 | 30 | 1,361.9 | 2,421.1 | 3,783.0 | 122.5 | ||
21 | 2,175.2 | 0.0 | 2,175.2 | 70.4 | 24 | 2,514.7 | 0.0 | 2,514.7 | 81.4 | 28 | 2,908.9 | 0.0 | 2,908.9 | 94.2 | ||
1 | 168.6 | 0.0 | 168.6 | 5.5 | 1 | 194.9 | 0.0 | 194.9 | 6.3 | 1 | 225.5 | 0.0 | 225.5 | 7.3 | ||
1 | 66.9 | 0.0 | 66.9 | 2.2 | 1 | 77.4 | 0.0 | 77.4 | 2.5 | 1 | 89.5 | 0.0 | 89.5 | 2.9 | ||
1 | 162.9 | 0.0 | 162.9 | 5.3 | 1 | 188.3 | 0.0 | 188.3 | 6.1 | 1 | 217.8 | 0.0 | 217.8 | 7.1 | ||
1 | 50.6 | 43.1 | 93.8 | 3.0 | 1 | 58.5 | 49.9 | 108.4 | 3.5 | 1 | 67.7 | 57.7 | 125.4 | 4.1 | ||
9 | 498.0 | 584.7 | 1,082.7 | 35.1 | 10 | 575.8 | 676.0 | 1,251.8 | 40.5 | 12 | 666.1 | 781.9 | 1,448.0 | 46.9 | ||
3 | 329.6 | 0.0 | 329.6 | 10.7 | 4 | 381.1 | 0.0 | 381.1 | 12.3 | 4 | 440.9 | 0.0 | 440.9 | 14.3 | ||
7 | 1,113.8 | 0.0 | 1,113.8 | 36.1 | 8 | 1,287.8 | 0.0 | 1,287.8 | 41.7 | 10 | 1,489.6 | 0.0 | 1,489.6 | 48.2 | ||
6 | 303.9 | 211.2 | 515.0 | 16.7 | 7 | 310.0 | 215.5 | 525.5 | 17.0 | 8 | 406.4 | 282.4 | 688.8 | 22.3 | ||
2 | 68.4 | 0.0 | 68.4 | 2.2 | 2 | 79.0 | 0.0 | 79.0 | 2.6 | 3 | 91.4 | 0.0 | 91.4 | 3.0 | ||
1 | 155.7 | 0.0 | 155.7 | 5.0 | 1 | 180.0 | 0.0 | 180.0 | 5.8 | 2 | 208.2 | 0.0 | 208.2 | 6.7 | ||
21 | 2,017.0 | 1,584.8 | 3,601.7 | 116.6 | 25 | 2,332.0 | 1,832.3 | 4,164.3 | 134.8 | 29 | 2,697.5 | 2,119.4 | 4,816.9 | 156.0 | ||
8 | 906.7 | 943.7 | 1,850.5 | 59.9 | 9 | 1,048.3 | 1,091.1 | 2,139.5 | 69.3 | 11 | 1,212.6 | 1,262.1 | 2,474.8 | 80.1 | ||
2 | 192.0 | 192.0 | 384.1 | 12.4 | 2 | 222.0 | 222.0 | 444.0 | 14.4 | 3 | 256.8 | 256.8 | 513.6 | 16.6 | ||
1 | 84.1 | 84.1 | 168.2 | 5.4 | 1 | 97.3 | 97.3 | 194.5 | 6.3 | 1 | 112.5 | 112.5 | 225.0 | 7.3 | ||
2 | 267.2 | 267.2 | 534.4 | 17.3 | 2 | 308.9 | 308.9 | 617.8 | 20.0 | 3 | 357.3 | 357.3 | 714.7 | 23.1 | ||
40 | 7,854.3 | 242.9 | 8,097.2 | 262.2 | 47 | 9,080.6 | 280.8 | 9,361.5 | 303.1 | 54 | 10,503.8 | 324.9 | 10,828.6 | 350.6 | ||
1 | 5.7 | 136.8 | 142.5 | 4.6 | 1 | 158.1 | 0.0 | 158.1 | 5.1 | 1 | 190.5 | 0.0 | 190.5 | 6.2 | ||
3 | 397.7 | 397.7 | 795.3 | 25.8 | 4 | 459.8 | 459.8 | 919.5 | 29.8 | 4 | 531.8 | 531.8 | 1,063.6 | 34.4 | ||
1 | 38.3 | 38.3 | 76.6 | 2.5 | 1 | 44.3 | 44.3 | 88.6 | 2.9 | 1 | 51.2 | 51.2 | 102.4 | 3.3 | ||
1 | 48.7 | 48.7 | 97.4 | 3.2 | 1 | 56.3 | 56.3 | 112.6 | 3.6 | 1 | 65.1 | 65.1 | 130.2 | 4.2 | ||
4 | 453.1 | 0.0 | 453.1 | 14.7 | 5 | 523.9 | 0.0 | 523.9 | 17.0 | 6 | 606.0 | 0.0 | 606.0 | 19.6 | ||
17 | 1,795.2 | 0.0 | 1,795.2 | 58.1 | 19 | 1,976.4 | 0.0 | 1,976.4 | 64.0 | 22 | 2,286.2 | 0.0 | 2,286.2 | 74.0 | ||
5 | 678.7 | 0.0 | 678.7 | 22.0 | 5 | 784.6 | 0.0 | 784.6 | 25.4 | 6 | 907.6 | 0.0 | 907.6 | 29.4 | ||
7 | 1,350.1 | 0.0 | 1,350.1 | 43.7 | 8 | 1,561.0 | 0.0 | 1,561.0 | 50.5 | 9 | 1,805.6 | 0.0 | 1,805.6 | 58.5 | ||
7 | 1,388.7 | 0.0 | 1,388.7 | 45.0 | 8 | 1,605.6 | 0.0 | 1,605.6 | 52.0 | 9 | 1,857.2 | 0.0 | 1,857.2 | 60.1 | ||
289 | 30,231.1 | 7,277.4 | 37,508.4 | 1,214.6 | 332 | 34,962.9 | 8,227.1 | 43,190.0 | 1,398.5 | 386 | 40,498.0 | 9,549.6 | 50,047.6 | 1,620.6 | ||
Profile - Fall Semester 2015
Division/Department/Discipline | # of Sec | WSCH | WSCH Sec | FTES | Lec Hrs | Lab Hrs |
Liberal Arts & Sciences | ||||||
English Department | ||||||
English Department | 77 | 4,974.5 | 64.6 | 161.1 | 295 | 41 |
ESL | 14 | 764.6 | 54.6 | 24.8 | 59 | 0 |
Humanities | 4 | 588.3 | 147.1 | 19.1 | 16 | 0 |
Fine Arts | ||||||
Art | 18 | 2,440.6 | 135.6 | 79.0 | 53 | 96 |
Communication | 20 | 1,876.7 | 93.8 | 60.8 | 60 | 0 |
French | 1 | 145.5 | 145.5 | 4.7 | 5 | 0 |
Journalism | 1 | 57.8 | 57.8 | 1.9 | 3 | 0 |
Japanese | 1 | 140.5 | 140.5 | 4.6 | 5 | 0 |
MCTV- TV | 3 | 80.9 | 27.0 | 2.6 | 7 | 6 |
Music | 8 | 934.2 | 116.8 | 30.3 | 17 | 20 |
Philosophy | 3 | 284.4 | 94.8 | 9.2 | 9 | 0 |
Spanish | 7 | 961.1 | 137.3 | 31.1 | 35 | 0 |
Theatre Arts | 6 | 444.4 | 74.1 | 14.4 | 17 | 12 |
Library | 2 | 59.0 | 29.5 | 1.9 | 2 | 0 |
Natural Sciences & Ma | th | |||||
Astronomy | 1 | 134.3 | 134.3 | 4.4 | 4 | 0 |
Biology | 18 | 3,107.7 | 172.6 | 100.6 | 64 | 51 |
Chemistry | 7 | 1,596.6 | 228.1 | 51.7 | 23 | 24 |
Ecology | 2 | 331.4 | 165.7 | 10.7 | 6 | 6 |
Environmental Science | 1 | 145.1 | 145.1 | 4.7 | 3 | 3 |
Geology | 2 | 461.1 | 230.5 | 14.9 | 6 | 6 |
Mathematics | 38 | 6,986.2 | 183.8 | 226.2 | 152 | 6 |
Mathematics (Online) | 1 | 122.9 | 122.9 | 4.0 | 4 | 0 |
Physics | 3 | 686.2 | 228.7 | 22.2 | 9 | 9 |
Physical Science | 1 | 66.1 | 66.1 | 2.1 | 3 | 3 |
Physical Science (online) | 1 | 84.0 | 84.0 | 2.7 | 3 | 3 |
Social Science | ||||||
Anthropology | 5 | 391.0 | 78.2 | 12.7 | 15 | 0 |
History | 12 | 1,474.9 | 122.9 | 47.8 | 36 | 0 |
Political Science | 4 | 585.5 | 146.4 | 19.0 | 12 | 0 |
Psychology | 9 | 1,164.9 | 129.4 | 37.7 | 27 | 0 |
Sociology | 9 | 1,198.2 | 133.1 | 38.8 | 27 | 0 |
subtotal | 279 | 32,288.7 | 115.7 | 1,045.5 | 977 | 286 |
Actual
![]()
![]()
![]()
Cambridge West Partnership, LLC
247
Projected | ||||||||||||||||
2020 | 2025 | 2030 | ||||||||||||||
# of | Lec | Lab | Total | # of | Lec | Lab | Total | # of | Lec | Lab | Total | |||||
Sec | WSCH | WSCH | WSCH | FTES | Sec | WSCH | WSCH | WSCH | FTES | Sec | WSCH | WSCH | WSCH | FTES | ||
10 | 1,532.7 | 1,950.6 | 3,483.3 | 112.8 | 12 | 1,772.0 | 2,255.3 | 4,027.3 | 130.4 | 14 | 2,049.7 | 2,608.8 | 4,658.5 | 150.8 | ||
1 | 49.6 | 63.2 | 112.8 | 3.7 | 2 | 57.4 | 73.0 | 130.4 | 4.2 | 2 | 66.4 | 84.5 | 150.8 | 4.9 | ||
2 | 168.2 | 0.0 | 168.2 | 5.4 | 2 | 194.5 | 0.0 | 194.5 | 6.3 | 2 | 225.0 | 0.0 | 225.0 | 7.3 | ||
0.0 | 0.0 | |||||||||||||||
2 | 404.9 | 536.8 | 941.7 | 30.5 | 3 | 468.2 | 620.6 | 1,088.8 | 35.3 | 3 | 541.5 | 717.9 | 1,259.4 | 40.8 | ||
0.0 | 0.0 | |||||||||||||||
7 | 802.1 | 0.0 | 802.1 | 26.0 | 8 | 927.4 | 0.0 | 927.4 | 30.0 | 9 | 1,072.7 | 0.0 | 1,072.7 | 34.7 | ||
1 | 134.6 | 0.0 | 134.6 | 4.4 | 1 | 155.6 | 0.0 | 155.6 | 5.0 | 1 | 180.0 | 0.0 | 180.0 | 5.8 | ||
8 | 557.9 | 536.0 | 1,093.8 | 35.4 | 10 | 644.9 | 619.7 | 1,264.6 | 40.9 | 11 | 746.1 | 716.8 | 1,462.9 | 47.4 | ||
2 | 100.5 | 69.9 | 170.4 | 5.5 | 2 | 116.2 | 80.8 | 197.0 | 6.4 | 3 | 134.4 | 93.4 | 227.9 | 7.4 | ||
6 | 561.2 | 0.0 | 561.2 | 18.2 | 6 | 648.9 | 0.0 | 648.9 | 21.0 | 8 | 750.6 | 0.0 | 750.6 | 24.3 | ||
15 | 666.7 | 503.0 | 1,169.7 | 37.9 | 18 | 770.8 | 581.5 | 1,352.3 | 43.8 | 21 | 891.6 | 672.6 | 1,564.3 | 50.7 | ||
11 | 420.1 | 316.9 | 737.0 | 23.9 | 13 | 485.7 | 366.4 | 852.0 | 27.6 | 15 | 561.8 | 423.8 | 985.7 | 31.9 | ||
2 | 169.8 | 59.7 | 229.4 | 7.4 | 3 | 196.3 | 69.0 | 265.3 | 8.6 | 3 | 227.1 | 79.8 | 306.8 | 9.9 | ||
1 | 0.0 | 0.0 | 1 | 0.0 | 0.0 | 0.0 | 0.0 | 1 | 0.0 | 0.0 | 0.0 | 0.0 | ||||
4 | 445.3 | 0.0 | 445.3 | 14.4 | 5 | 514.8 | 0.0 | 514.8 | 16.7 | 6 | 595.5 | 0.0 | 595.5 | 19.3 | ||
3 | 295.7 | 0.0 | 295.7 | 9.6 | 4 | 341.8 | 0.0 | 341.8 | 11.1 | 4 | 395.4 | 0.0 | 395.4 | 12.8 | ||
3 | 166.4 | 0.0 | 166.4 | 5.4 | 3 | 192.4 | 0.0 | 192.4 | 6.2 | 4 | 222.6 | 0.0 | 222.6 | 7.2 | ||
1 | 97.4 | 0.0 | 97.4 | 3.2 | 1 | 112.6 | 0.0 | 112.6 | 3.6 | 1 | 130.2 | 0.0 | 130.2 | 4.2 | ||
79 | 6,573.1 | 4,036.0 | 10,609.0 | 343.5 | 94 | 7,599.4 | 4,666.2 | 12,265.6 | 397.2 | 108 | 8,790.6 | 5,397.6 | 14,188.2 | 459.4 | ||
7 | 543.9 | 153.4 | 697.3 | 22.6 | 8 | 628.8 | 177.4 | 806.2 | 26.1 | 10 | 727.4 | 205.2 | 932.6 | 30.2 | ||
3 | 197.9 | 55.8 | 253.7 | 8.2 | 3 | 228.9 | 64.5 | 293.4 | 9.5 | 4 | 264.7 | 74.7 | 339.4 | |||
4 | 493.2 | 1,972.9 | 2,466.1 | 79.9 | 5 | 570.3 | 2,281.0 | 2,851.3 | 92.3 | 5 | 659.6 | 2,638.5 | 3,298.1 | 106.8 | ||
1 | 0.0 | 32.6 | 32.6 | 1.1 | 1 | 0.0 | 37.7 | 37.7 | 1.2 | 1 | 0.0 | 43.6 | 43.6 | 1.4 | ||
3 | 399.1 | 0.0 | 399.1 | 12.9 | 4 | 461.4 | 0.0 | 461.4 | 14.9 | 1 | 133.4 | 0.0 | 133.4 | 4.3 | ||
18 | 1,634.1 | 2,214.7 | 3,848.8 | 124.6 | 21 | 1,889.4 | 2,560.6 | 4,450.0 | 144.1 | 21 | 1,785.1 | 2,962.0 | 4,747.1 | 142.7 | ||
Profile - Fall Semester 2015
Division/Department/Discipline | # of Sec | WSCH | WSCH Sec | FTES | Lec Hrs | Lab Hrs |
CTE Allied Health Allied Health Allied Health (Online) Health Education Aviation Maintenance Aviation Maintenance Business Accounting Accounting (Online) Admin of Justice Business Office Business Computer Sci & Info Sys Computer Sci & Info Sys (Online) Digital Media Digital Media (Online) Economics Economics (Online) Law Enforcement Marketing (Online) | 10 | 3,005.5 | 300.5 | 97.3 | 45 | 71 |
2 | 97.3 | 48.7 | 3.2 | 9 | 12 | |
2 | 145.1 | 72.6 | 4.7 | 9 | 0 | |
3 | 812.5 | 270.8 | 26.3 | 26 | 34 | |
8 | 692.1 | 86.5 | 22.4 | 29 | 0 | |
1 | 116.1 | 116.1 | 3.8 | 3 | 0 | |
8 | 943.8 | 118.0 | 30.6 | 45 | 44 | |
4 | 147.0 | 36.8 | 4.8 | 8 | 6 | |
5 | 484.2 | 96.8 | 15.7 | 15 | 0 | |
22 | 1,009.2 | 45.9 | 32.7 | 101 | 75 | |
16 | 635.9 | 39.7 | 20.6 | 68 | 38 | |
4 | 198.0 | 49.5 | 6.4 | 17 | 6 | |
1 | 0.0 | 0.0 | 0.0 | 0 | 0 | |
4 | 384.2 | 96.0 | 12.4 | 16 | 0 | |
4 | 255.1 | 63.8 | 8.3 | 16 | 0 | |
1 | 143.6 | 143.6 | 4.7 | 4 | 0 | |
1 | 84.0 | 84.0 | 2.7 | 3 | 0 | |
96 | 9,153.6 | 95.3 | 296.4 | 414 | 285 | |
CTE Other Child Development Child Development (Online) Cosmetology Coop Wk Experience Water Resources subtotal | ||||||
8 4 4 1 4 | 601.6 219.0 2,127.8 28.1 344.3 | 75.2 54.7 531.9 28.1 86.1 | 19.5 7.1 68.9 0.9 11.2 | 29 14 16 0 12 | 8 4 64 5 0 | |
21 | 3,320.8 | 158.1 | 107.5 | 71 | 81 | |
Kinesiology Kinesiology Athletics | 18 16 | 1,725.1 2,423.0 | 95.8 151.4 | 55.9 78.5 | 0 11 | 54 89 |
subtotal | 34 | 4,148.1 | 122.0 | 134.3 | 11 | 143 |
23 18 | 0.0 308.9 | 1,999.4 2,499.4 | 1,999.4 2,808.3 | 64.7 90.9 |
41 | 308.9 | 4,498.8 | 4,807.7 | 155.7 |
26 21 | 0.0 357.1 | 2,311.7 2,889.7 | 2,311.7 3,246.8 | 74.9 105.1 |
47 | 357.1 | 5,201.4 | 5,558.5 | 180.0 |
30 24 | 0.0 413.1 | 2,673.9 3,342.6 | 2,673.9 3,755.7 | 86.6 121.6 |
54 | 413.1 | 6,016.5 | 6,429.6 | 208.2 |
Counseling Counseling & Guidance Guidance (Online) | 23 2 | 396.5 138.0 | 17.2 69.0 | 12.8 4.5 | 34 5 | 0 0 |
subtotal | 25 | 534.6 | 21.4 | 17.3 | 34 | 0 |
26 2 | 459.7 160.0 | 0.0 0.0 | 459.7 160.0 | 14.9 5.2 |
28 | 619.7 | 0.0 | 619.7 | 20.1 |
30 3 | 531.3 185.0 | 0.0 0.0 | 531.3 185.0 | 17.2 6.0 |
33 | 716.3 | 0.0 | 716.3 | 23.2 |
35 3 | 614.6 214.0 | 0.0 0.0 | 614.6 214.0 | 19.9 6.9 |
38 | 828.6 | 0.0 | 828.6 | 26.8 |
Actual
![]()
![]()
491 41,610.2 18,191.6 59,801.8 1,936.4
656 55,315.7 24,146.0 79,461.7 2,562.1
569 48,118.8 20,845.8 68,964.5 2,233.1
![]()
16 456.5 318.9 775.4 25.1
18 502.1 367.9 870.0 28.2
14 394.1 275.8 669.9 21.7
![]()
674 55,817.8 24,513.9 80,331.7 2,590.2
585 48,575.3 21,164.7 69,739.9 2,258.3
505 42,004.3 18,467.4 60,471.7 1,958.1
Cambridge West Partnership, LLC
248
Projected | ||||||||||||||||
2020 | 2025 | 2030 | ||||||||||||||
# of | Lec | Lab | Total | # of | Lec | Lab | Total | # of | Lec | Lab | Total | |||||
Sec | WSCH | WSCH | WSCH | FTES | Sec | WSCH | WSCH | WSCH | FTES | Sec | WSCH | WSCH | WSCH | FTES | ||
8 | 1,259.9 | 0.0 | 1,259.9 | 40.8 | 9 | 1,456.7 | 0.0 | 1,456.7 | 47.2 | 11 | 1,685.0 | 0.0 | 1,685.0 | 54.6 | ||
8 | 366.7 | 164.8 | 531.5 | 17.2 | 10 | 424.0 | 190.5 | 614.5 | 19.9 | 11 | 490.5 | 220.4 | 710.9 | 23.0 | ||
5 | 112.1 | 0.0 | 112.1 | 3.6 | 6 | 129.5 | 0.0 | 129.5 | 4.2 | 7 | 149.8 | 0.0 | 149.8 | 4.9 | ||
15 | 504.7 | 0.0 | 504.7 | 16.3 | 17 | 583.4 | 0.0 | 583.4 | 18.9 | 20 | 675.0 | 0.0 | 675.0 | 21.9 | ||
36 | 2,243.4 | 164.8 | 2,408.2 | 78.0 | 42 | 2,593.6 | 190.5 | 2,784.1 | 90.2 | 49 | 3,000.3 | 220.4 | 3,220.7 | 104.3 | ||
Profile - Fall Semester 2015
Division/Department/Discipline | # of Sec | WSCH | WSCH Sec | FTES | Lec Hrs | Lab Hrs |
Disability Resource Center Vocational Prep Adaptive PE Computer Science & Info Sys Guidance subtotal | 8 10 6 10 | 1,087.1 458.6 96.7 435.4 | 135.9 45.9 16.1 43.5 | 35.2 14.8 3.1 14.1 | 24 24 56 60 | 0 12 0 0 |
34 | 2,077.8 | 61.1 | 67.3 | 164 | 12 | |
Credit Total | 489 51,523.5 105.4 1,668.4 1,671 807 |
Division/Department/Discipline | # of Sec | WSCH | WSCH Sec | FTES | Lec Hrs | Lab Hrs | |
Non Credit | |||||||
Allied Health (Online) | 1 | 197.0 | 197.0 | 4.1 | 4 | 0 | |
Guidance (Online) | 1 | 2.5 | 2.5 | 0.1 | 2 | 0 | |
English | 3 | 256.9 | 85.6 | 0.5 | 3 | 28 | |
Library (Online) | 10 | 119.5 | 12.0 | 3.9 | 65 | 3 | |
subtotal | 15 | 576.0 | 38.4 | 8.4 | 74 | 31 | |
# of Sec | Lec WSCH | Lab WSCH | Total WSCH | FTES |
1 | 228.4 | 2.3 | 230.7 | 7.5 |
1 | 2.9 | 0.0 | 2.9 | 0.1 |
2 | 29.8 | 268.0 | 297.8 | 9.6 |
10 | 133.0 | 5.5 | 138.5 | 4.5 |
14 | 394.1 | 275.8 | 669.9 | 21.7 |
# of Sec | Lec WSCH | Lab WSCH | Total WSCH | FTES |
1 | 264.6 | 2.6 | 267.2 | 8.7 |
1 | 3.3 | 0.0 | 3.3 | 0.1 |
2 | 34.5 | 309.9 | 344.4 | 11.2 |
12 | 154.1 | 6.4 | 160.5 | 5.2 |
16 | 456.5 | 318.9 | 775.4 | 25.1 |
# of Sec | Lec WSCH | Lab WSCH | Total WSCH | FTES |
2 | 305.4 | 3.1 | 308.5 | 10.0 |
1 | 3.8 | 0.0 | 3.8 | 0.1 |
3 | 39.8 | 358.4 | 398.2 | 12.9 |
12 | 153.1 | 6.4 | 159.5 | 5.2 |
18 | 502.1 | 367.9 | 870.0 | 28.2 |
Non Credit Total | 15 576.0 38.4 8.5 74 31 |
Grand Total Campus | 504 52,099.5 103.4 1,676.8 1,745 838 |
Actual | |||||||
Profile - Fall Semester 2015 | |||||||
Division/Department/Discipline | # of Sec | WSCH | WSCH Sec | FTES | Lec Hrs | Lab Hrs | |
OFF Campus | |||||||
Off Site Apprentice | |||||||
Carpenter Apprentice | 37 | 838.1 | 22.7 | 27.1 | 348 | 444 | |
Drywall-Lathing | 18 | 397.1 | 22.1 | 12.9 | 117 | 283 | |
Off Site Programs | |||||||
JFT Fire Technology | 11 | 601.6 | 54.7 | 19.5 | 24 | 68 | |
JLE Law Enforcement | 28 | 3,345.4 | 119.5 | 108.3 | 29 | 145 | |
subtotal | 94 | 5,182.2 | 55.1 | 167.8 | 518 | 940 | |
Projected | ||||||
2020 | 2025 | 2030 | ||||
# of Lec Lab Total Sec WSCH WSCH WSCH FTES | # of Lec Lab Total Sec WSCH WSCH WSCH FTES | # of Lec Lab Total Sec WSCH WSCH WSCH FTES | ||||
12 181.3 515.9 697.2 22.6 30 659.2 3,218.3 3,877.5 125.6 | 14 210.1 597.9 808.0 26.2 35 763.8 3,729.1 4,492.9 145.5 | 17 243.5 693.2 936.7 30.3 41 885.5 4,323.5 5,209.0 168.7 | ||||
42 840.5 3,734.2 4,574.7 148.1 | 49 973.9 4,327.0 5,300.9 171.6 | 58 1,129.0 5,016.7 6,145.7 199.0 | ||||
Campus and Off Campus Total | 598 57,281.7 159 1,844.6 2,263 1,778 |
![]()
732 56,946.8 29,530.6 86,477.4 2,789.2
634 49,549.2 25,491.7 75,040.8 2,429.9
547 42,844.8 22,201.6 65,046.4 2,106.3
Cambridge West Partnership, LLC
249
Actual
Cambridge West Partnership, LLC
250
Projected | |||||||||||||||
2020 | 2025 | 2030 | |||||||||||||
# of | Lec | Lab | Total | # of | Lec | Lab | Total | # of | Lec | Lab | Total | ||||
Sec | WSCH | WSCH | WSCH | FTES | Sec | WSCH | WSCH | WSCH | FTES | Sec | WSCH | WSCH | WSCH | FTES | |
1 | 14.6 | 0.0 | 14.6 | 0.5 | 1 | 17.0 | 0.0 | 17.0 | 0.5 | 1 | 19.0 | 0.0 | 19.0 | 0.6 | |
1 | 1.1 | 0.0 | 1.1 | 0.0 | 1 | 1.2 | 0.0 | 1.2 | 0.0 | 1 | 1.4 | 0.0 | 1.4 | 0.0 | |
1 | 103.0 | 0.0 | 103.0 | 3.3 | 1 | 120.0 | 0.0 | 120.0 | 3.9 | 1 | 134.3 | 0.0 | 134.3 | 4.4 | |
1 | 10.7 | 0.0 | 10.7 | 0.3 | 1 | 12.4 | 0.0 | 12.4 | 0.4 | 1 | 13.9 | 0.0 | 13.9 | 0.5 | |
1 | 0.0 | 0.0 | 0.0 | 0.0 | 0 | 0.0 | 0.0 | 0.0 | - | 0 | 0.0 | 0.0 | 0.0 | 0.0 | |
1 | 13.1 | 13.1 | 26.3 | 0.9 | 1 | 0.0 | 15.3 | 15.3 | 0.5 | 1 | 0.0 | 17.1 | 17.1 | 0.6 | |
9 | 782.4 | 0.0 | 782.4 | 25.3 | 10 | 911.7 | 0.0 | 911.7 | 29.5 | 11 | 1,020.5 | 0.0 | 1,020.5 | 33.0 | |
2 | 33.2 | 0.0 | 33.2 | 1.1 | 2 | 38.7 | 0.0 | 38.7 | 1.3 | 2 | 43.3 | 129.9 | 173.3 | 5.6 | |
2 | 239.4 | 0.0 | 239.4 | 7.8 | 3 | 278.9 | 0.0 | 278.9 | 9.0 | 3 | 312.2 | 0.0 | 312.2 | 10.1 | |
1 | 77.4 | 0.0 | 77.4 | 2.5 | 1 | 90.2 | 0.0 | 90.2 | 2.9 | 1 | 101.0 | 0.0 | 101.0 | 3.3 | |
2 | 376.8 | 0.0 | 376.8 | 12.2 | 3 | 439.1 | 0.0 | 439.1 | 14.2 | 3 | 491.5 | 0.0 | 491.5 | 15.9 | |
5 | 810.1 | 0.0 | 810.1 | 26.2 | 6 | 786.6 | 0.0 | 786.6 | 25.5 | 6 | 1,056.6 | 0.0 | 1,056.6 | 34.2 | |
3 | 458.9 | 0.0 | 458.9 | 14.9 | 5 | 534.7 | 0.0 | 534.7 | 17.3 | 6 | 598.5 | 0.0 | 598.5 | 19.4 | |
2 | 261.4 | 0.0 | 261.4 | 8.5 | 3 | 203.0 | 0.0 | 203.0 | 6.6 | 3 | 340.9 | 0.0 | 340.9 | 11.0 | |
2 | 125.4 | 0.0 | 125.4 | 4.1 | 1 | 292.2 | 0.0 | 292.2 | 9.5 | 1 | 163.5 | 0.0 | 163.5 | 5.3 | |
3 | 107.6 | 0.0 | 107.6 | 3.5 | 3 | 125.4 | 0.0 | 125.4 | 4.1 | 4 | 140.4 | 0.0 | 140.4 | 4.5 | |
5 | 232.3 | 0.0 | 232.3 | 7.5 | 5 | 270.6 | 0.0 | 270.6 | 8.8 | 6 | 303.0 | 0.0 | 303.0 | 9.8 | |
42 | 3,647.2 | 13.1 | 3,660.3 | 118.5 | 47 | 4,121.7 | 15.3 | 4,137.0 | 134.0 | 51 | 4,740.1 | 147.1 | 4,887.1 | 158.3 | |
Profile - Fall Semester 2015
Center | # of Sec | WSCH | WSCH Sec | FTES | Lec Hrs | Lab Hrs |
Hollister Center | 1 1 1 1 1 1 10 1 2 1 3 4 3 2 1 2 4 | 12.7 0.9 89.6 9.3 8.3 11.4 680.3 115.5 208.2 67.3 327.7 704.4 399.0 227.3 109.0 93.6 202.0 | 12.7 0.9 89.6 9.3 8.3 11.4 68.0 115.5 104.1 67.3 109.2 176.1 133.0 113.6 109.0 46.8 50.5 | 0.4 0.0 2.9 0.3 0.3 0.4 22.0 3.7 6.7 2.2 10.6 22.8 12.9 7.4 3.5 3.0 6.5 | 3 0 3 3 0 0 40 2 6 3 5 16 9 6 3 8 6 | 0 0 0 0 0 3 0 6 0 0 0 0 0 0 0 0 0 |
Guidance Allied Health Health Education Accounting Business Office Tech CSIS English Art Communication Philosophy Spanish Mathematics History Psychology Sociology Non Credit English Non Credit ESL | ||||||
subtotal | 39 | 3,266.4 | 83.8 | 105.8 | 113 | 9 |
Actual
Cambridge West Partnership, LLC
Projected | |||||||||||||||
2020 | 2025 | 2030 | |||||||||||||
# of | Lec | Lab | Total | # of | Lec | Lab | Total | # of | Lec | Lab | Total | ||||
Sec | WSCH | WSCH | WSCH | FTES | Sec | WSCH | WSCH | WSCH | FTES | Sec | WSCH | WSCH | WSCH | FTES | |
1 | 15.3 | 0.0 | 15.3 | 0.5 | 1 | 18.6 | 0.0 | 18.6 | 0.6 | 1 | 20.8 | 0.0 | 20.8 | 0.7 | |
1 | 163.4 | 0.0 | 163.4 | 5.3 | 1 | 199.0 | 0.0 | 199.0 | 6.4 | 2 | 222.8 | 0.0 | 222.8 | 7.2 | |
1 | 0.0 | 28.9 | 28.9 | 0.9 | 1 | 0.0 | 35.2 | 35.2 | 1.1 | 1 | 0.0 | 39.4 | 39.4 | 1.3 | |
1 | 47.2 | 0.0 | 47.2 | 1.5 | 1 | 57.5 | 0.0 | 57.5 | 1.9 | 1 | 64.4 | 0.0 | 64.4 | 2.1 | |
1 | 72.7 | 0.0 | 72.7 | 2.4 | 1 | 88.6 | 0.0 | 88.6 | 2.9 | 1 | 99.1 | 0.0 | 99.1 | 3.2 | |
1 | 117.9 | 0.0 | 117.9 | 3.8 | 2 | 71.8 | 0.0 | 71.8 | 2.3 | 2 | 160.7 | 0.0 | 160.7 | 5.2 | |
1 | 0.0 | 112.8 | 112.8 | 3.7 | 1 | 0.0 | 137.4 | 137.4 | 4.4 | 12 | 0.0 | 153.8 | 153.8 | 5.0 | |
8 | 743.3 | 0.0 | 743.3 | 24.1 | 10 | 905.4 | 0.0 | 905.4 | 29.3 | 2 | 1,013.6 | 0.0 | 1,013.6 | 32.8 | |
2 | 41.9 | 85.1 | 127.1 | 4.1 | 2 | 51.1 | 103.7 | 154.8 | 5.0 | 3 | 57.2 | 116.1 | 173.3 | 5.6 | |
2 | 221.8 | 0.0 | 221.8 | 7.2 | 3 | 270.2 | 0.0 | 270.2 | 8.8 | 3 | 302.5 | 0.0 | 302.5 | 9.8 | |
1 | 84.6 | 0.0 | 84.6 | 2.7 | 1 | 103.0 | 0.0 | 103.0 | 3.3 | 1 | 115.3 | 0.0 | 115.3 | 3.7 | |
1 | 165.8 | 0.0 | 165.8 | 5.4 | 1 | 201.9 | 0.0 | 201.9 | 6.5 | 1 | 226.1 | 0.0 | 226.1 | 7.3 | |
1 | 123.3 | 0.0 | 123.3 | 4.0 | 1 | 150.2 | 0.0 | 150.2 | 4.9 | 2 | 168.2 | 0.0 | 168.2 | 5.4 | |
6 | 1,069.7 | 0.0 | 1,069.7 | 34.6 | 7 | 1,303.1 | 0.0 | 1,303.1 | 42.2 | 8 | 1,458.7 | 0.0 | 1,458.7 | 47.2 | |
1 | 54.4 | 0.0 | 54.4 | 1.8 | 1 | 66.2 | 0.0 | 66.2 | 2.1 | 1 | 74.1 | 0.0 | 74.1 | 2.4 | |
1 | 148.5 | 0.0 | 148.5 | 4.8 | 1 | 180.8 | 0.0 | 180.8 | 5.9 | 1 | 202.4 | 0.0 | 202.4 | 6.6 | |
2 | 229.0 | 0.0 | 229.0 | 7.4 | 2 | 278.9 | 0.0 | 278.9 | 9.0 | 3 | 312.2 | 0.0 | 312.2 | 10.1 | |
3 | 133.8 | 0.0 | 133.8 | 4.3 | 3 | 163.0 | 0.0 | 163.0 | 5.3 | 3 | 182.5 | 0.0 | 182.5 | 5.9 | |
3 | 186.8 | 0.0 | 186.8 | 6.1 | 4 | 227.6 | 0.0 | 227.6 | 7.4 | 5 | 254.8 | 0.0 | 254.8 | 8.3 | |
38 | 3,619.4 | 226.8 | 3,846.2 | 124.5 | 44 | 4,337.3 | 276.3 | 4,613.5 | 149.4 | 53 | 4,935.5 | 309.3 | 5,244.8 | 169.8 | |
Profile - Fall Semester 2015
Division | # of Sec | WSCH | WSCH Sec | FTES | Lec Hrs | Lab Hrs |
Morgan Hills Center | ||||||
Guidance | 1 | 13.9 | 13.9 | 0.5 | 3 | 0 |
Admin of Justice | 2 | 148.54 | 74.3 | 4.8 | 6 | 0 |
CSIS | 1 | 26.25 | 26.3 | 0.9 | 0 | 3 |
Digital Media | 1 | 42.93 | 42.9 | 1.4 | 3 | 0 |
Child Development | 2 | 66.09 | 33.0 | 2.1 | 6 | 0 |
DRC Voc Training | 2 | 107.16 | 53.6 | 3.5 | 6 | 0 |
Kinesiology | 1 | 102.53 | 102.5 | 3.3 | 0 | 3 |
English | 9 | 675.71 | 75.1 | 21.9 | 36 | 0 |
Art | 1 | 115.50 | 115.5 | 3.7 | 2 | 4 |
Communication | 2 | 201.66 | 100.8 | 6.5 | 6 | 0 |
Philosophy | 1 | 76.90 | 76.9 | 2.5 | 3 | 0 |
Spanish | 1 | 150.71 | 150.7 | 4.9 | 4 | 0 |
Astronomy | 1 | 112.10 | 112.1 | 3.6 | 3 | 0 |
Mathematics | 5 | 972.49 | 194.5 | 31.5 | 20 | 0 |
Anthropology | 1 | 49.41 | 49.4 | 1.6 | 3 | 0 |
Geography | 1 | 134.96 | 135.0 | 4.4 | 3 | 0 |
History | 2 | 208.15 | 104.1 | 6.7 | 6 | 0 |
Political Science | 1 | 121.68 | 121.7 | 3.9 | 3 | 0 |
Non Credit ESL | 3 | 169.85 | 56.6 | 5.5 | 9 | 0 |
38 | 3,496.5 | 92.0 | 113.2 | 122 | 10 | |
Grand Totals | 77 6,763 87.8 219 235 19 |
![]()
104 9,676 456 10,132 328
91 8,459 292 8,751 283
80 7,267 240 7,506 243
251
Source: Gavilan College Office of Institutional Research; analysis by Cambridge West Partnership, LLC
Cambridge West Partnership, LLC
![]()
![]()
![]()
Classes taught off the campus or through distance education were excluded from this projection analysis.
CURRENT ASF | PROJECTED | |||||||||||||||||||
2015 | 2015 | 2020 | 2025 | 2030 | ||||||||||||||||
Division | Lec | Lab | Other | Total | # of | Lec | Lab | Total | # of | Lec | Lab | Total | # of | Lec | Lab | Total | # of | Lec | Lab | Total |
![]()
Department/Discipline ASF ASF ASF ASF Liberal Arts & Science
252
English | 3,228 | 792 | 2,375 | 6,395 | 77 | 2,065.8 | 910.5 | 2,976 | 79 | 2,399.8 | 1,037.8 | 3,438 | 91 | 2,774.6 | 1,199.8 | 3,974 | 106 | 3,209.4 | 1,387.9 | 4,597 |
ESL | 2,193 | 2,193 | 14 | 361.7 | 0.0 | 362 | 8 | 419.2 | 0.0 | 419 | 10 | 484.6 | 0.0 | 485 | 11 | 560.6 | 0.0 | 561 | ||
Humanities | 0 | 4 | 278.3 | 0.0 | 278 | 6 | 322.5 | 0.0 | 323 | 7 | 372.9 | 0.0 | 373 | 8 | 431.3 | 0.0 | 431 |
English Department
SEC ASF ASF ASF
SEC ASF ASF ASF
SEC ASF ASF ASF
SEC ASF ASF ASF
Fine Arts Art Communication French Journalism Japanese MCTC - TV Music Philosophy Spanish Theatre Arts Library Natural Science & Math Astronomy Biology Chemistry Ecology Environmental Science Geology Mathematics Math (Online) Physics Physical Science Phy Sci (Online) Social Science Anthropology History Political Science Psychology Sociology Lecture Rooms (3) | 813 716 949 2,818 1,001 2,970 | 5,156 367 2,747 1,340 2,134 3,979 1,260 1,973 2,187 | 1,131 4,622 | 5,156 1,131 0 367 0 0 2,747 0 813 5,962 2,850 0 4,928 1,260 0 0 0 4,791 3,188 0 0 0 0 0 0 0 2,970 | 18 | 410.6 | 4,041.3 | 4,452 | 23 | 481.7 | 4,652.8 | 5,134 | 26 | 556.9 | 5,379.4 | 5,936 | 30 | 644.2 | 6,222.3 | 6,866 |
20 | 887.7 | 0.0 | 888 | 21 | 1,028.9 | 0.0 | 1,029 | 24 | 1,189.5 | 0.0 | 1,189 | 28 | 1,375.9 | 0.0 | 1,376 | |||||
1 | 68.8 | 0.0 | 69 | 1 | 79.7 | 0.0 | 80 | 1 | 92.2 | 0.0 | 92 | 1 | 106.6 | 0.0 | 107 | |||||
1 | 27.3 | 0.0 | 27 | 1 | 31.7 | 0.0 | 32 | 1 | 36.6 | 0.0 | 37 | 1 | 42.3 | 0.0 | 42 | |||||
1 | 66.5 | 0.0 | 66 | 1 | 77.0 | 0.0 | 77 | 1 | 89.1 | 0.0 | 89 | 1 | 103.0 | 0.0 | 103 | |||||
3 | 20.6 | 96.0 | 117 | 1 | 24.0 | 110.9 | 135 | 1 | 27.7 | 128.2 | 156 | 1 | 32.0 | 148.3 | 180 | |||||
8 | 203.0 | 1,297.8 | 1,501 | 9 | 235.6 | 1,502.6 | 1,738 | 10 | 272.4 | 1,737.2 | 2,010 | 12 | 315.1 | 2,009.6 | 2,325 | |||||
3 | 134.5 | 0.0 | 135 | 3 | 155.9 | 0.0 | 156 | 4 | 180.3 | 0.0 | 180 | 4 | 208.5 | 0.0 | 209 | |||||
7 | 454.6 | 0.0 | 455 | 7 | 526.8 | 0.0 | 527 | 8 | 609.1 | 0.0 | 609 | 10 | 704.6 | 0.0 | 705 | |||||
6 | 123.2 | 472.6 | 596 | 6 | 143.7 | 542.7 | 686 | 7 | 146.6 | 553.7 | 700 | 8 | 192.2 | 725.8 | 918 | |||||
2 | 27.9 | 0.0 | 28 | 2 | 32.3 | 0.0 | 32 | 2 | 37.4 | 0.0 | 37 | 3 | 43.3 | 0.0 | 43 | |||||
1 | 63.5 | 0.0 | 64 | 1 | 73.6 | 0.0 | 74 | 1 | 85.1 | 0.0 | 85 | 2 | 98.5 | 0.0 | 98 | |||||
18 | 818.1 | 3,211.2 | 4,029 | 21 | 954.0 | 3,692.5 | 4,646 | 25 | 1,103.0 | 4,269.2 | 5,372 | 29 | 1,275.9 | 4,938.3 | 6,214 | |||||
7 | 369.6 | 2,095.3 | 2,465 | 8 | 428.9 | 2,425.4 | 2,854 | 9 | 495.9 | 2,804.2 | 3,300 | 11 | 573.6 | 3,243.7 | 3,817 | |||||
2 | 78.4 | 386.0 | 464 | 2 | 90.8 | 447.4 | 538 | 2 | 105.0 | 517.3 | 622 | 3 | 121.5 | 598.4 | 720 | |||||
1 | 34.3 | 169.1 | 203 | 1 | 39.8 | 196.0 | 236 | 1 | 46.0 | 226.6 | 273 | 1 | 53.2 | 262.1 | 315 | |||||
2 | 109.0 | 592.5 | 702 | 2 | 126.4 | 686.7 | 813 | 2 | 146.1 | 793.9 | 940 | 3 | 169.0 | 918.3 | 1,087 | |||||
38 | 3,179.0 | 397.9 | 3,577 | 40 | 3,715.1 | 364.4 | 4,079 | 47 | 4,295.1 | 421.3 | 4,716 | 54 | 4,968.3 | 487.3 | 5,456 | |||||
1 | 23.3 | 110.6 | 134 | 1 | 2.7 | 205.1 | 208 | 1 | 74.8 | 0.0 | 75 | 1 | 90.1 | 0.0 | 90 | |||||
3 | 162.3 | 881.8 | 1,044 | 3 | 188.1 | 1,022.0 | 1,210 | 4 | 217.5 | 1,181.6 | 1,399 | 4 | 251.5 | 1,366.7 | 1,618 | |||||
1 | 15.6 | 84.9 | 101 | 1 | 18.1 | 98.4 | 117 | 1 | 20.9 | 113.8 | 135 | 1 | 24.2 | 131.6 | 156 | |||||
1 | 19.9 | 107.9 | 128 | 1 | 23.0 | 125.1 | 148 | 1 | 26.6 | 144.6 | 171 | 1 | 30.8 | 167.3 | 198 | |||||
5 | 184.9 | 0.0 | 185 | 4 | 214.3 | 0.0 | 214 | 5 | 247.8 | 0.0 | 248 | 6 | 286.6 | 0.0 | 287 | |||||
12 | 697.6 | 0.0 | 698 | 17 | 849.1 | 0.0 | 849 | 19 | 934.8 | 0.0 | 935 | 22 | 1,081.4 | 0.0 | 1,081 | |||||
4 | 277.0 | 0.0 | 277 | 5 | 321.0 | 0.0 | 321 | 5 | 371.1 | 0.0 | 371 | 6 | 429.3 | 0.0 | 429 | |||||
9 | 551.0 | 0.0 | 551 | 7 | 638.6 | 0.0 | 639 | 8 | 738.3 | 0.0 | 738 | 9 | 854.0 | 0.0 | 854 | |||||
9 | 566.8 | 0.0 | 567 | 7 | 656.9 | 0.0 | 657 | 8 | 759.4 | 0.0 | 759 | 9 | 878.5 | 0.0 | 878 | |||||
Subtotal | 14,688 | 21,935 | 8,128 | 44,751 | 279 | 12,281 | 14,855 | 27,136 | 289 | 14,299 | 17,110 | 31,409 | 332 | 16,537 | 19,471 | 36,008 | 386 | 19,156 | 22,608 | 41,763 |
CURRENT ASF | PROJECTED | ||||||||||||||||||||
2016 | 2016 | 2020 | 2025 | 2030 | |||||||||||||||||
CTE | Lec | Lab | Other | Total | # of | Lec | Lab | Total | # of | Lec | Lab | Total | # of | Lec | Lab | Total | # of | Lec | Lab | Total | |
Department/Discipline | ASF | ASF | ASF | ASF | SEC | ASF | ASF | ASF | SEC | ASF | ASF | ASF | SEC | ASF | ASF | ASF | SEC | ASF | ASF | ASF | |
Allied Health Allied Health | 1,046 | 5,115 | 6,161 | 10 | 556.9 | 3,912.3 | 4,469 | 10 | 724.9 | 4,174.4 | 4,899 | 12 | 838.2 | 4,826.3 | 5,665 | 14 | 969.5 | 5,582.7 | 6,552 | ||
Aviation Maintenance Aviation Maintenance Business Accounting Accounting (Online) Admin of Justice Business Office Business Computer Sci & Info Sys Comp Sci (Online) Digital Media Dig Media (Online) Economics Econ (Online) Law Enforcement Marketing | 488 1,357 | 8,747 1,362 397 6,453 819 | 584 | 0 9,235 0 1,362 0 397 8,394 819 0 0 | 0 | 0 | ||||||||||||||
3 | 166.1 | 3,455.5 | 3,622 | 2 | 191.5 | 4,020.4 | 4,212 | 3 | 221.4 | 4,648.2 | 4,870 | 3 | 256.1 | 5,376.8 | 5,633 | |||||
8 | 327.4 | 0.0 | 327 | 7 | 379.4 | 0.0 | 379 | 8 | 438.6 | 0.0 | 439 | 9 | 507.4 | 0.0 | 507 | |||||
1 | 54.9 | 0.0 | 55 | 1 | 63.7 | 0.0 | 64 | 1 | 73.6 | 0.0 | 74 | 1 | 85.1 | 0.0 | 85 | |||||
8 | 225.7 | 998.5 | 1,224 | 8 | 263.9 | 1,147.0 | 1,411 | 10 | 305.1 | 1,326.1 | 1,631 | 11 | 352.9 | 1,534.0 | 1,887 | |||||
4 | 41.2 | 76.7 | 118 | 2 | 47.5 | 89.4 | 137 | 2 | 55.0 | 103.4 | 158 | 3 | 63.6 | 119.6 | 183 | |||||
5 | 229.0 | 0.0 | 229 | 6 | 265.5 | 0.0 | 265 | 6 | 306.9 | 0.0 | 307 | 8 | 355.0 | 0.0 | 355 | |||||
22 | 273.9 | 735.4 | 1,009 | 15 | 315.4 | 860.1 | 1,175 | 18 | 364.6 | 994.4 | 1,359 | 21 | 421.7 | 1,150.2 | 1,572 | |||||
16 | 192.9 | 389.8 | 583 | 11 | 198.7 | 541.9 | 741 | 13 | 229.7 | 626.5 | 856 | 15 | 265.7 | 724.7 | 990 | |||||
4 | 69.2 | 110.5 | 180 | 2 | 80.3 | 127.7 | 208 | 3 | 92.8 | 147.6 | 240 | 3 | 107.4 | 170.7 | 278 | |||||
2 | 1 | 1 | 0.0 | 0.0 | 0 | 1 | 0.0 | 0.0 | 0 | |||||||||||
4 | 181.7 | 0.0 | 182 | 4 | 210.6 | 0.0 | 211 | 5 | 243.5 | 0.0 | 244 | 6 | 281.7 | 0.0 | 282 | |||||
4 | 120.7 | 0.0 | 121 | 3 | 139.8 | 0.0 | 140 | 4 | 161.7 | 0.0 | 162 | 4 | 187.0 | 0.0 | 187 | |||||
1 | 0 | 3 | 78.7 | 0.0 | 79 | 3 | 91.0 | 0.0 | 91 | 4 | 105.3 | 0.0 | 105 | |||||||
1 | 39.7 | 0.0 | 40 | 1 | 46.1 | 0.0 | 46 | 1 | 53.2 | 0.0 | 53 | 1 | 61.6 | 0.0 | 62 | |||||
subtotal | 2,891 | 22,893 | 584 | 26,368 | 97 | 2,568 | 9,797 | 12,365 | 79 | 3,109 | 11,096 | 14,205 | 94 | 3,595 | 12,829 | 16,423 | 108 | 4,158 | 14,840 | 18,997 |
CTE Other Child Development | 2,221 | 2,221 | 8 | 202.3 | 125.0 | 327 | 7 | 257.3 | 394.2 | 651 | 8 | 297.4 | 455.8 | 753 | 10 | 344.0 | 527.2 | 871 |
Coop Work Experience Water Resource | 2,015 | 0 2,015 | 1 4 | 0.0 147.7 | 72.2 0.0 | 72 148 | 1 3 | 0.0 188.8 | 83.7 0.0 | 84 189 | 1 4 | 0.0 218.2 | 96.8 0.0 | 97 218 | 1 4 | 0.0 252.4 | 111.9 0.0 | 112 252 | |||
subtotal | 0 | 6,535 | 2,221 | 8,756 | 21 | 606 | 8,215 | 8,820 | 18 | 773 | 4,843 | 5,616 | 21 | 894 | 5,600 | 6,493 | 24 | 1,034 | 6,477 | 7,511 | |
Kinesiology | Kinesiology Athletics | 0 0 | 18 | 0.0 | 5,537.5 | 5,538 | 23 | 0.0 | 6,418.0 | 6,418 | 26 | 0.0 | 7,420.4 | 7,420 | 30 | 0.0 | 8,583.2 | 8,583 | |||
16 | 114.3 | 6,922.4 | 7,037 | 18 | 146.1 | 8,023.2 | 8,169 | 21 | 168.9 | 9,275.8 | 9,445 | 24 | 195.4 | 10,729.8 | 10,925 | ||||||
Subtotal | 34 | 114 | 12,460 | 12,574 | 41 | 146 | 14,441 | 14,587 | 47 | 169 | 16,696 | 16,865 | 54 | 195 | 19,313 | 19,508 | |||||
Counseling | Guidance Guidance (Online) | 0 | 697 | 697 | 23 | 170.1 | 0.0 | 170 | 26 | 217.4 | 102.8 | 320 | 30 | 251.3 | 0.0 | 251 | 35 | 290.7 | 0.0 | 291 | |
2 | 59.2 | 0.0 | 59 | 2 | 75.7 | 35.8 | 111 | 3 | 87.5 | 0.0 | 87 | 3 | 101.2 | 0.0 | 101 | ||||||
Subtotal | 0 | 0 | 697 | 697 | 25 | 229 | 0 | 229 | 28 | 293 | 139 | 432 | 33 | 339 | 0 | 339 | 38 | 392 | 0 | 392 | |
Disability Resource Center Vocational Prep (Mostly Offsite) 0 | 8 | 466.3 | 0.0 | 466 | 8 | 595.9 | 0.0 | 596 | 9 | 689.0 | 0.0 | 689 | 11 | 797.0 | 0.0 | 797 | |||||
Cambridge West Partnership, LLC
253
Allied Health (Online) | 2 | 20.0 | 117.9 | 138 | 1 | 23.5 | 135.2 | 159 | 2 | 27.1 | 156.3 | 183 | 2 | 31.4 | 180.8 | 212 | |
Health Education | 0 | 2 | 68.7 | 0.0 | 69 | 2 | 79.6 | 0.0 | 80 | 2 | 92.0 | 0.0 | 92 | 2 | 106.4 | 0.0 | 106 |
Child Dev (Online) | 4 | 73.1 | 4,374.7 | 4,448 | 3 | 93.6 | 143.5 | 237 | 3 | 108.2 | 165.9 | 274 | 4 | 125.2 | 191.9 | 317 | ||
Cosmetology | 4,520 | 4,520 | 4 | 182.6 | 3,642.8 | 3,825 | 4 | 233.3 | 4,222.1 | 4,455 | 5 | 269.7 | 4,881.3 | 5,151 | 5 | 312.0 | 5,646.3 | 5,958 |
Adaptive PE | 0 | 10 | 131.2 | 490.7 | 622 | 8 | 173.5 | 423.5 | 597 | 10 | 200.6 | 489.6 | 690 | 11 | 232.0 | 566.3 | 798 | |||
Computer Science& Info Sys | 1,253 1,253 | 6 | 41.5 | 0.0 | 41 | 5 | 53.0 | 0.0 | 53 | 6 | 61.3 | 0.0 | 61 | 7 | 70.9 | 0.0 | 71 | |||
Guidance | 0 | 10 | 186.8 | 0.0 | 187 | 15 | 238.7 | 0.0 | 239 | 17 | 276.0 | 0.0 | 276 | 20 | 319.3 | 0.0 | 319 | |||
Subtotal | 0 | 0 | 1,253 | 1,253 | 34 | 826 | 491 | 1,316 | 36 | 1,061 | 423 | 1,485 | 42 | 1,227 | 490 | 1,716 | 49 | 1,419 | 566 | 1,985 |
Total Credit | 17,579 51,363 | 12,883 81,825 | 490 | 16,624 | 45,817 | 62,441 | 491 | 19,682 | 48,053 | 67,734 | 569 | 22,760 | 55,085 | 77,845 | 659 | 26,354 | 63,804 | 90,158 | ||
![]()
CURRENT ASF PROJECTED
2015 2015 2020 2025 2030 | ||||||||||||||||||||
Lec | Lab | Other | Total | # OF | Lec | Lab | Total | # OF | Lec | Lab | Total | # OF | Lec | Lab | Total | # OF | Lec | Lab | Total | |
Department/Discipline | ASF | ASF | ASF | ASF | SEC | ASF | ASF | ASF | SEC | ASF | ASF | ASF | SEC | ASF | ASF | ASF | SEC | ASF | ASF | ASF |
Non Credit Allied Health Guidance English Library | 0 0 0 0 | 1 | 84.5 | 0.0 | 85 | 1 | 108.0 | 5.9 | 114 | 1 | 124.9 | 6.8 | 132 | 2 | 144.5 | 7.8 | 152 | |||
1 | 1.1 | 0.0 | 1 | 1 | 1.4 | 0.0 | 1 | 1 | 1.6 | 0.0 | 2 | 1 | 1.8 | 0.0 | 2 | |||||
3 | 10.7 | 348.1 | 359 | 2 | 14.1 | 402.0 | 416 | 2 | 16.3 | 464.8 | 481 | 3 | 18.8 | 537.6 | 556 | |||||
10 | 49.0 | 7.9 | 57 | 10 | 62.9 | 8.3 | 71 | 12 | 72.9 | 9.6 | 83 | 12 | 72.4 | 9.6 | 82 | |||||
Total | 0 | 0 | 0 | 0 | 15 | 145 | 356 | 501 | 14 | 186 | 416 | 603 | 16 | 216 | 481 | 697 | 18 | 238 | 555 | 793 |
OFF Campus (On Inventory) Morgan Hill (6-3 Rms) Hollister (4-2 Rms) Off Site (Not on Inventory) Apprentice Programs Carpenter Apprentice Drywell-Lathing Off Site Programs JFT Fire Technology JLE Law Enforcement | 4726 3378 | 1879 1734 | 6,605 5,112 | |||||||||||||||||
Subtotal | 8,104 | 3,613 | 11,717 | |||||||||||||||||
Grand Total | 25,683 | 54,976 | 12,883 | 93,542 | 505 | 16,769 | 46,173 | 62,943 | 505 | 19,868 | 48,469 | 68,337 | 585 | 22,976 | 55,566 | 78,542 | 677 | 26,591 | 64,359 | 90,950 |
Cambridge West Partnership, LLC
254
Source: Gavilan College Fusion Database and Five-Year Capital Construction Plan; analysis by Cambridge West Partnership, LLC